Crinkly Curves
By Brian Hayes
Some curves are so convoluted they wiggle free of the one-dimensional world and fill up space
Some curves are so convoluted they wiggle free of the one-dimensional world and fill up space

DOI: 10.1511/2013.102.178
In 1877 the German mathematician Georg Cantor made a shocking discovery. He found that a two-dimensional surface contains no more points than a one-dimensional line. Cantor compared the set of all points forming the area of a square with the set of points along one of the line segments on the perimeter of the square. He showed that the two sets are the same size. Intuition rebels against this notion. Inside a square you could draw infinitely many parallel line segments side by side. Surely an area with room for such an infinite array of lines must include more points than a single line—but it doesn’t. Cantor himself was incredulous: “I see it, but I don’t believe it,” he wrote.
Yet the fact was inescapable. Cantor defined a one-to-one correspondence between the points of the square and the points of the line segment. Every point in the square was associated with a single point in the segment; every point in the segment was matched with a unique point in the square. No points were left over or used twice. It was like pairing up mittens: If you come out even at the end, you must have started with equal numbers of lefts and rights.
Geometrically, Cantor’s one-to-one mapping is a scrambled affair. Neighboring points on the line scatter to widely separated destinations in the square. The question soon arose: Is there a continuous mapping between a line and a surface? In other words, can one trace a path through a square without ever lifting the pencil from the paper and touch every point at least once? It took a decade to find the first such curve. Then dozens more were invented, as well as curves that fill up a three-dimensional volume or even a region of some n-dimensional space. The very concept of dimension was undermined.
Circa 1900, these space-filling curves were viewed as mysterious aberrations, signaling how far mathematics had strayed from the world of everyday experience. The mystery has never entirely faded away, but the curves have grown more familiar. They are playthings of programmers now, nicely adapted to illustrating certain algorithmic techniques (especially recursion). More surprising, the curves have turned out to have practical applications. They serve to encode geographic information; they have a role in image processing; they help allocate resources in large computing tasks. And they tickle the eye of those with a taste for intricate geometric patterns.
It’s easy to sketch a curve that completely fills the interior of a square. The finished product looks like this:

How uninformative! It’s not enough to know that every point is covered by the passage of the curve; we want to see how the curve is constructed and what route it follows through the square.
If you were designing such a route, you might start out with the kind of path that’s good for mowing a lawn:

But there’s a problem with these zigzags and spirals. A mathematical lawn mower cuts a vanishingly narrow swath, and so you have to keep reducing the space between successive passes. Unfortunately, the limiting pattern when the spacing goes to zero is not a filled area; it is a path that forever retraces the same line along one edge of the square or around its perimeter, leaving the interior blank.
The first successful recipe for a space-filling curve was formulated in 1890 by Giuseppe Peano, an Italian mathematician also noted for his axioms of arithmetic. Peano did not provide a diagram or even an explicit description of what his curve might look like; he merely defined a pair of mathematical functions that give x and y coordinates inside a square for each position t along a line segment.
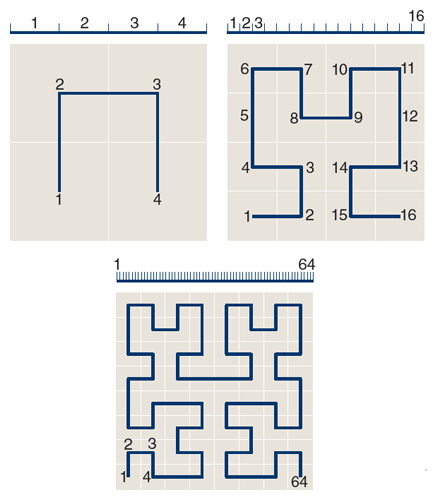
Illustration by Brian Hayes.
Soon David Hilbert, a leading light of German mathematics in that era, devised a simplified version of Peano’s curve and discussed its geometry. The illustration above is a redrawing of a diagram from Hilbert’s 1891 paper, showing the first three stages in the construction of the curve.
The illustration below shows a later stage in the evolution of the Hilbert curve, when it has become convoluted enough that one might begin to believe it will eventually reach all points in the square. The curve was drawn by a computer program written in a recursive style that I call programming by procrastination. The philosophy behind the approach is this: Plotting all those twisty turns looks like a tedious job, so why not put it off as long as we can? Maybe we’ll never have to face it.
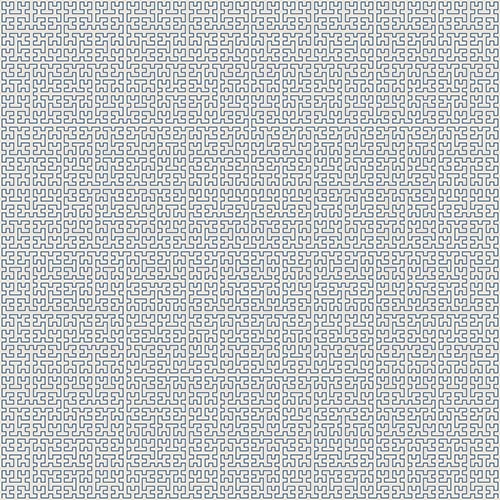
Illustration by Brian Hayes.
Let us eavesdrop on a computer program named Hilbert as it mumbles to itself while trying to solve this problem:
Hmm. I’m supposed to draw a curve that fills a square. I don’t know how to do that, but maybe I can cut the problem down to size. Suppose I had a subroutine that would fill a smaller square, say one-fourth as large. I could invoke that procedure on each quadrant of the main square, getting back four separate pieces of the space-filling curve. Then, if I just draw three line segments to link the four pieces into one long curve, I’ll be finished!
Of course I don’t actually have a subroutine for filling in a quadrant. But a quadrant of a square is itself a square. There’s a program named Hilbert that’s supposed to be able to draw a space-filling curve in any square. I’ll just hand each of the quadrants off to Hilbert .
The strategy described in this monologue may sound like a totally pointless exercise. The Hilbert program keeps subdividing the problem but has no plan for ever actually solving it. However, this is one of those rare and wonderful occasions when procrastination pays off, and the homework assignment you lazily set aside last night is miraculously finished when you get up in the morning.
Consider the sizes of the successive subsquares in Hilbert’s divide-and-conquer process. At each stage, the side length of the square is halved, and the area is reduced to one-fourth. The limiting case, if the process goes on indefinitely, is a square of zero side length and zero area. So here’s the procrastinator’s miracle: Tracing a curve that touches all the points inside a size-zero square is easy, because such a square is in fact a single point. Just draw it!
Practical-minded readers will object that a program running in a finite machine for a finite time will not actually reach the limiting case of squares that shrink away to zero size. I concede the point. If the recursion is halted while the squares still contain multiple points, one of those points must be chosen as a representative; the center of the square is a likely candidate. In making the illustration above, I stopped the program after seven levels of recursion, when the squares were small but certainly larger than a single point. The wiggly blue line connects the centers of 47 = 16,384 squares. Only in the mind’s eye will we ever see a true, infinite space-filling curve, but a finite drawing like this one is at least a guide to the imagination.
There is one more important aspect of this algorithm that I have glossed over. If the curve is to be continuous—with no abrupt jumps—then all the squares have to be arranged so that one segment of the curve ends where the next segment begins. Matching up the end points in this way requires rotating and reflecting some of the subsquares. (For an animated illustration of these transformations, see http://bit-player.org/extras/hilbert.)
The procrastinator’s algorithm is certainly not the only way to draw a space-filling curve. Another method exploits the self-similarity of the pattern—the presence of repeated motifs that appear in each successive stage of the construction. In the Hilbert curve the basic motif is a U-shaped path with four possible orientations. In going from one stage of refinement to the next, each U orientation is replaced by a specific sequence of four smaller U curves, along with line segments that link them together, as shown in the illustration below. The substitution rules form a grammar that generates geometric figures in the same way that a linguistic grammar generates phrases and sentences.
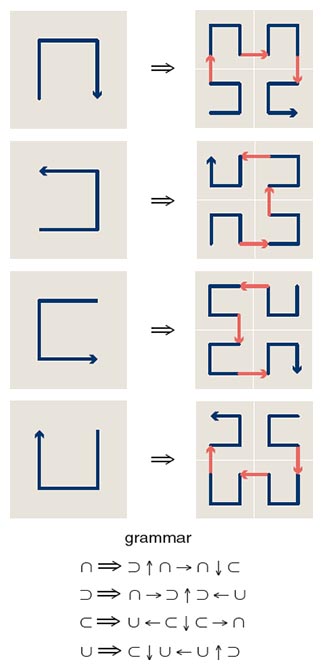
Illustration by Brian Hayes.
The output of the grammatical process is a sequence of symbols. An easy way to turn it into a drawing is to interpret the symbols as commands in the language of “turtle graphics.” The turtle is a conceptual drawing instrument, which crawls over the plane in response to simple instructions to move forward, turn left or turn right. The turtle’s trail across the surface becomes the curve to be drawn.
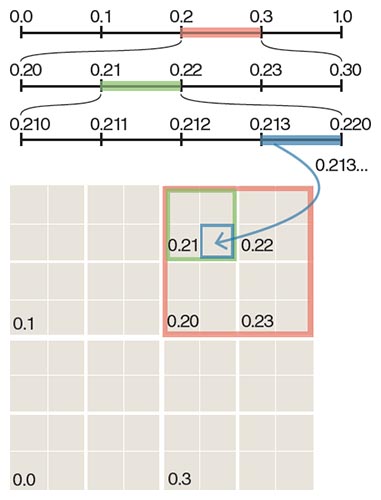
Illustration by Brian Hayes.
When Peano and Hilbert were writing about the first space-filling curves, they did not explain them in terms of grammatical rules or turtle graphics. Instead their approach was numerical, assigning a number in the interval [0,1] to every point on a line segment and also to every point in a square. For the Hilbert curve, it’s convenient to do this arithmetic in base 4, or quaternary, working with the digits 0, 1, 2, 3. In a quaternary fraction such as 0.213, each successive digit specifies a quadrant or subquadrant of the square, as outlined in the illustration above.
What about other space-filling curves? Peano’s curve is conceptually similar to Hilbert’s but divides the square into nine regions instead of four. Another famous example was invented in 1912 by the Polish mathematician Waclaw Sierpinski; it partitions the square along its diagonals, forming triangles that are then further subdivided. A more recent invention is the “flowsnake” curve devised in the 1970s by Bill Gosper.
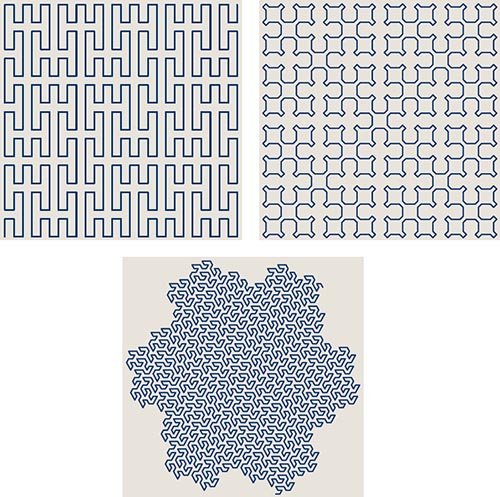
Illustration by Brian Hayes.
Filling three-dimensional space turns out to be even easier than filling the plane—or at least there are more ways to do it. Herman Haverkort of the Eindhoven Institute of Technology in the Netherlands has counted the three-dimensional analogues of the Hilbert curve; there are more than 10 million of them.
In everyday speech the word curve suggests something smooth and fluid, without sharp corners, such as a parabola or a circle. The Hilbert curve is anything but smooth. All finite versions of the curve consist of 90-degree bends connected by straight segments. In the infinite limit, the straight segments dwindle away to zero length, leaving nothing but sharp corners. The curve is all elbows. In 1900 the American mathematician Eliakim Hastings Moore came up with the term “crinkly curves” for such objects.
In many respects these curves are reminiscent of fractals, the objects of fractional dimension that Benoit Mandelbrot made famous. The curves’ self-similarity is fractal-like: Zooming in reveals ever more intricate detail. But the Hilbert curve is not a fractal, because its dimension is not a fraction. Any finite approximation is simply a one-dimensional line. On passing to the limit of infinite crinkliness, the curve suddenly becomes a two-dimensional square. There is no intermediate state.
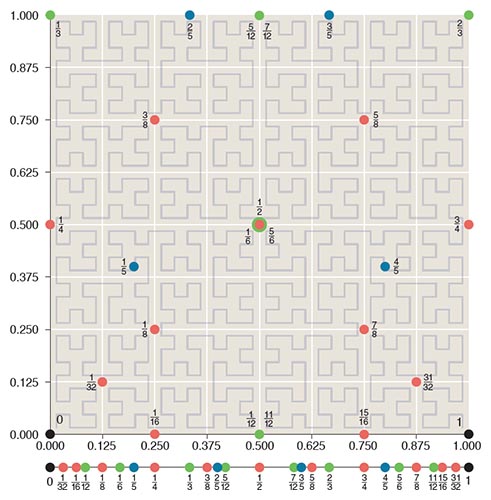
Illustration by Brian Hayes.
Even though the complete path of an infinite space-filling curve cannot be drawn on paper, it is still a perfectly well-defined object. You can calculate the location along the curve of any specific point you might care to know about. The result is exact if the input is exact. A few landmark points for the Hilbert curve are plotted in the illustration above (For an interactive version of this illustration, see http://bit-player.org/extras/hilbert/).
The algorithm for this calculation implements the definition of the curve as a mapping from a one-dimensional line segment to a two-dimensional square. The input to the function is a number in the interval [0,1], and the output is a pair of x, y coordinates.
The inverse mapping—from x, y coordinates to the segment [0,1]—is more troublesome. The problem is that a point in the square can be linked to more than one point on the line.
Cantor’s dimension-defying function was a one-to-one mapping: Each point on the line was associated with exactly one point in the square, and vice versa. But Cantor’s mapping was not continuous: Adjacent points on the line did not necessarily map to adjacent points in the square. In contrast, the space-filling curves are continuous but not one-to-one. Although each point on the line is associated with a unique point in the square, a point in the square can map back to multiple points on the line. A conspicuous example is the center of the square, with the coordinates x =1/2, y =1/2. Three separate locations on the line segment (1/6, 1/2 and 5/6) all connect to this one point in the square.
Space-filling curves have been called monsters, but they are useful monsters. One of their most remarkable applications was reported 30 years ago by John J. Bartholdi III and his colleagues at the Georgia Institute of Technology. Their aim was to find efficient routes for drivers delivering Meals on Wheels to elderly clients scattered around the city of Atlanta. Finding the best possible delivery sequence would be a challenging task even with a powerful computer. Meals on Wheels didn’t need the solution to be strictly optimal, but they needed to plan and revise routes quickly, and they had to do it with no computing hardware at all. Bartholdi and his coworkers came up with a scheme that used a map, a few pages of printed tables and two Rolodex files.
Planning a route started with Rolodex cards listing the delivery addresses. The manager looked up the map coordinates of each address, then looked up those coordinates in a table, which supplied an index number to write on the Rolodex card. Sorting the cards by index number yielded the delivery sequence.
Behind the scenes in this procedure was a space-filling curve (specifically, a finite approximation to a Sierpinski curve) that had been superimposed on the map. The index numbers in the tables encoded position along this curve. The delivery route didn’t follow the Sierpinski curve, with all its crinkly turns. The curve merely determined the sequence of addresses, and the driver then chose the shortest point-to-point route between them.
A space-filling curve works well in this role because it preserves “locality.” If two points are nearby on the plane, they are likely to be nearby on the curve as well. The route makes no wasteful excursions across town and back again.
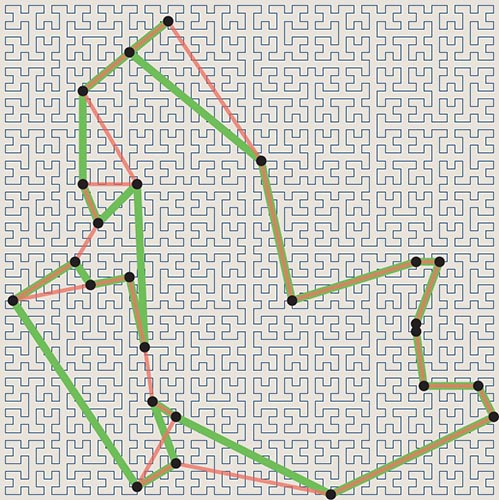
Illustration by Brian Hayes.
The Meals on Wheels scheduling task is an instance of the traveling salesman problem, a notorious stumper in computer science. The Bartholdi algorithm gives a solution that is not guaranteed to be best but is usually good. For randomly distributed locations, the tours average about 25 percent longer than the optimum. Other heuristic methods can beat this performance, but they are much more complicated. The Bartholdi method finds a route without even computing the distances between sites.
Locality is a helpful property in other contexts as well. Sometimes what’s needed is not a route from one site to the next but a grouping of sites into clusters. In two or more dimensions, identifying clusters can be difficult; threading a space-filling curve through the data set reduces it to a one-dimensional problem.
The graphic arts have enlisted the help of space-filling curves for a process known as halftoning, which allows black-and-white devices (such as laser printers) to reproduce shades of gray. Conventional halftoning methods rely on arrays of dots that vary in size to represent lighter and darker regions. Both random and regular arrays tend to blur fine features and sharp lines in an image. A halftone pattern that groups the dots along the path of a Hilbert or Peano curve can provide smooth tonal gradients while preserving crisp details.
Another application comes from a quite different realm: the multiplication of matrices (a critical step in large-scale computations). Accessing matrix elements by rows and columns requires the same values to be read from memory multiple times. In 2006 Michael Bader and Christoph Zenger of the Technical University of Munich showed that clustering the data with a space-filling curve reduces memory traffic.
Bader is also the author of an excellent recent book that discusses space-filling curves from a computational point of view. An earlier volume by Hans Sagan is more mathematical.
Given that people have found such a surprising variety of uses for these curious curves, I can’t help wondering whether nature has also put them to work. Other kinds of patterns are everywhere in the natural world: stripes, spots, spirals and many kinds of branching structures. But I can’t recall seeing a Peano curve on the landscape. The closest I can come are certain trace fossils (preserved furrows and burrows of organisms on the sea floor) and perhaps the ridges and grooves on the surface of the human cerebrum.
Applications of space-filling curves are necessarily built on finite examples—paths one can draw with a pencil or a computer. But in pure mathematics the focus is on the infinite case, where a line gets so incredibly crinkly that it suddenly becomes a plane.
Cantor’s work on infinite sets was controversial and divisive in his own time. Leopold Kronecker, who had been one of Cantor’s professors in Berlin, later called him “a corrupter of youth” and tried to block publication of the paper on dimension. But Cantor had ardent defenders, too. Hilbert wrote in 1926: “No one shall expel us from the paradise that Cantor has created.” Indeed, no one has been evicted. (A few have left of their own volition.)
Cantor’s discoveries eventually led to clearer thinking about the nature of continuity and smoothness, concepts at the root of calculus and analysis. The related development of space-filling curves called for a deeper look at the idea of dimension. From the time of Descartes, it was assumed that in d-dimensional space it takes d coordinates to state the location of a point. The Peano and Hilbert curves overturned this principle: A single number can define position on a line, on a plane, in a solid, or even in those 11-dimensional spaces so fashionable in high-energy physics.
At about the same time that Cantor, Peano and Hilbert were creating their crinkly curves, the English schoolmaster Edwin Abbott was writing his fable Flatland, about two-dimensional creatures that dream of popping out of the plane to see the world in 3D. The Flatlanders might be encouraged to learn that mere one-dimensional worms can break through to higher spaces just by wiggling wildly enough.
Click "American Scientist" to access home page
American Scientist Comments and Discussion
To discuss our articles or comment on them, please share them and tag American Scientist on social media platforms. Here are links to our profiles on Twitter, Facebook, and LinkedIn.
If we re-share your post, we will moderate comments/discussion following our comments policy.