Solvents, Ethanol, Car Crashes & Tolerance
By Philip J. Bushnell
How risky is inhalation of organic solvents?
How risky is inhalation of organic solvents?

DOI: 10.1511/2013.103.282
Darel woke from his dream of swordplay with iridescent lizards to a cold sense of hardness and thirst. The familiar headache and tingling in his ears blended with the hazy brown blankness of sunlight on the paper bag covering his face.
He inhaled deeply the remaining petrol and tried to return to the dream, but it was over. An urgent, annoying hunger roused him; he pushed away the bag, sat up slowly and waited for the spinning walls to shudder to a halt around him. He tried to steady his shaking hands and swore as he reached for and missed his shoe that had somehow become lodged under his hip. Where was his hat? He pulled his feet under him and reached for a chair. The shaking increased. He tried to hold the chair and pull himself up, but could not keep his hands still. Falling back to the floor, he waited for his body to quiet. His brother appeared above him. “Again?” he said. “I’m taking you to the doc.”

William Thomas Cain/AP Images
Lars approached the traffic circle between home and the paint shop where he had worked all his adult life. The holidays were approaching, and the brilliantly lit Christmas tree and crèche in the circle made him smile. So beautiful! He watched the lights fly by as he circled around, admiring the workmanship of the display. Looking up, he moved toward the exit. Wait. Is it this one? Or that one? Where am I going? To work, or home? The confusion made him continue in the roundabout. He looked at his lunch box on the seat beside him. Opening it, he saw the sandwich and apple that his wife had packed. Ah! Morning! To work.
Marcie pulled up to the Kwik-Stop in her new hybrid. She had just emptied her first tank of gas, and was excited to see how many gallons it had taken to go those 435 miles on the odometer. Adele fingered her pacifier and watched from her car seat as Marcie switched off the ignition and hunted for the gas cap release. There! She pulled it, got out and swiped her credit card in the gas pump. Adele began to fidget, so Marcie quickly pulled the nozzle from the pump and fumbled with the gas cap. In the process, she accidentally squeezed the pump handle and a little gasoline splashed on the car and her shoe. She loosened her grip on the handle, stopping the gas, pushed the spigot into the fuel tank and filled it. Adele was now whimpering, so Marcie got in the back seat beside her and soothed her. She noted the cloying smell of gas as she quieted Adele, who then napped as Marcie drove them home.
These three vignettes provide glimpses of known and potential hazards of volatile organic compounds, commonly known as organic solvents. Darel’s story is one of the teenage petrol-sniffer who inhales very high concentrations of gasoline. Repeated high-concentration exposure to these compounds can lead to motor and cognitive debilitation associated with loss of white matter in the central nervous system (CNS). Lars’s tale is an apocryphal recounting of the consequences of long-term occupational exposure to solvent vapors, which are found in oil-based paints and adhesives. Exposure to these vapors has been associated (particularly in Scandinavia) with cognitive deficits including loss of short-term memory. These two stories indicate that high-level exposure to hydrocarbon vapors can have serious debilitating consequences, a conclusion widely held in the field. But what about Marcie’s acute encounter with spilled gasoline? Should she worry about this isolated episode of exposure? Will it hurt her or her little girl?
A research program in the National Health and Environmental Effects Research Laboratory of the U.S. Environmental Protection Agency has led to some surprising considerations regarding the potential hazard of exposure to low concentrations of solvent vapors. This program involved conducting experiments to characterize the acute behavioral and neurophysiological effects of inhaling these vapors, developing computational models to understand the relation between the concentration of the vapor in the inhaled air and in critical tissues of the body, and carrying out meta-analyses of the relations between internal doses and various effects in rats and in humans. This experimental work demonstrated that inhaling solvent vapors causes robust changes in cognitive, sensory and motor function in rats; the concentration of the solvent in the brain at the time of functional measurement accurately predicts the magnitude of the effect; and computational models can accurately estimate the concentration of the solvent in the brain and blood under a variety of exposure scenarios. Meta-analyses of dose-effect relations in rats and in humans showed that the potency of the solvent depends greatly on the consequences associated with responding in the test, but, given similar incentives, rats and humans do not differ in their sensitivity to the four solvents tested.
Ethanol, the alcohol that is commonly consumed in a variety of drinks, is chemically an organic solvent and affects the CNS in ways that are very similar to the effects of other inhaled solvents. Because the effects of ethanol and some solvents have been measured using the same test methods, it is possible to relate the potency of solvents and ethanol quantitatively. We applied this relation, called a dose-equivalence equation, to the extensive database relating ingestion of ethanol to fatal automobile crashes. Surprisingly, this analysis revealed that acute exposure to solvent vapors at concentrations below those associated with long-term effects appears to increase the risk of a fatal automobile accident. Furthermore, this increase in risk is comparable to the risk of death from leukemia after long-term exposure to benzene, another solvent, which has the well-known property of causing this type of cancer.
However, other experiments have revealed also that rats can become tolerant to these “acute” effects of solvents—in some situations completely overcoming impairment that is initially caused by inhaling high concentrations of the chemical. After exploring several aspects of this tolerance, it became apparent that assessment of the risk of acute exposure to solvents is not simply a balance between toxicity and tolerance. As will be discussed below, it depends on value judgments and the perception of the risks and benefits associated with normal behavior. The best we can do under these circumstances is to pose the difficult questions about the degree to which the risk of acute exposure can be ameliorated by tolerance.
Our work with rats involved assessing their behavior or visual function while they inhaled a solvent. In these studies, a vapor is generated by evaporating the liquid solvent, diluting the vapor in clean air, and passing it through a chamber in which a rat is either working for food (see Figure 2, top) or viewing a video screen on which visual stimuli are presented (see Figure 2, bottom). For the behavioral studies, the rats are trained to press levers for food before they are exposed to any solvents. In these hour-long tests, a series of trials is presented in which a light flashes briefly during half of the trials (a “signal”). The lever that produces food depends on whether or not a signal occurred, and because the occurrence of the signal is unpredictable, we posit that the rat must attend to that light to respond accurately. Performance is quantified by counting the numbers of correct and incorrect responses (accuracy), and the time between insertion of the levers in each trial and the lever press (response time). An analogous procedure for human subjects has shown remarkable consistency between the two species across several important task parameters.
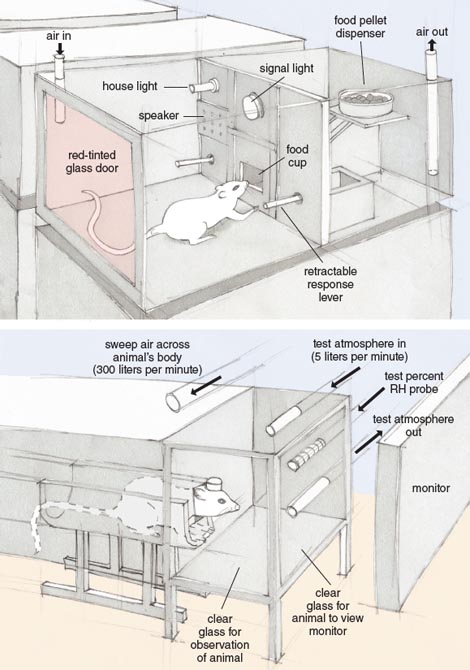
Illustration by Tom Dunne.
For electrophysiological studies of visual function, rats are first prepared surgically with electrodes on the surface of the skull. These electrodes detect the electrical activity over the visual cortex, which is driven by alternating patterns of visual stimuli on the video screen. Cortical neurons generate electrical signals that can be used to quantify visual function. Similar functions can be obtained from humans wearing scalp electrodes.
The effects of solvents on behavior and visual function are reliable, robust and directly related to the amount of the solvent inhaled. Behaviorally, accuracy decreases and response time increases with increasing exposure; visually, the amplitude of the recorded signal decreases with increasing exposure. At very high concentrations, animals become anesthetized; indeed, some solvents have historically been used as surgical anesthetics. These effects reflect steps along a general pathway often characterized as “narcosis.”
Of course, the amount of the solvent entering the brain depends on its concentration in the air and the duration of the exposure. In addition, this “internal dose” of the chemical is a complex function of the individual’s physiology (for example, breathing rate and cardiac output) and the solvent’s physicochemical properties. Computational methods have been developed to estimate internal doses of chemicals under a wide range of exposure conditions. Such physiologically based pharmacokinetic (PBPK) models incorporate these parameters into a set of differential equations representing the flux of the compound in blood and tissues. PBPK models for several solvents, including trichloroethylene and toluene, have been essential for understanding the effects of solvents on the CNS and the implications of inhaled solvents on public health.
Using the toluene PBPK model for rats, we examined the relation between exposure concentration (C), duration of exposure (t), and effects on signal detection behavior and visual function to determine the measure of dose (“dose metric”) that best explains the observed pattern of effects of several solvents, including toluene. This analysis revealed clearly that the concentration of the solvent in the brain at the time of measurement provided an accurate estimate of the magnitude of its effects on performance of the task, in comparison to the concentration and duration of exposure and two metrics of cumulative dose. The results for response time in the behavioral test are shown in Figure 3.
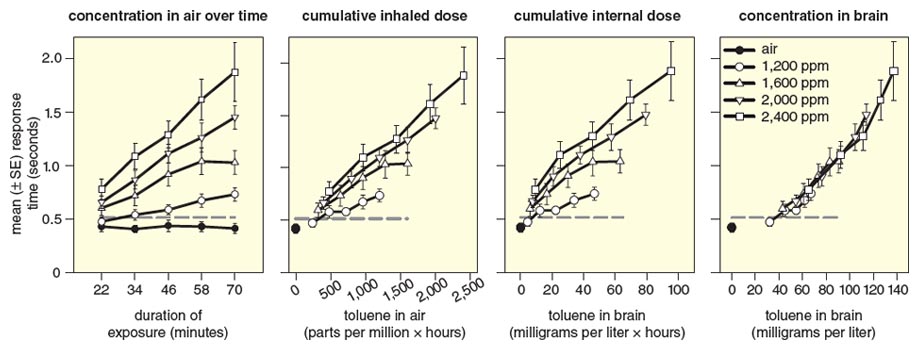
Illustration by Barbara Aulicino.
The left most panel of Figure 3 shows that response time remains almost constant when rats perform the test in clean air, but it rises with increasing C and t of exposure to toluene. Because both C and t affect performance, both variables must be known to determine the magnitude of the increase. Because the cumulative dose determines the effect of some chemicals, we plotted the same response-time data against the total amount of toluene inhaled at each time point (C x t) and the total amount in the brain (estimated from the PBPK model) to see whether these metrics improved prediction of the effect. These single metrics did improve the predictions (middle panels of Figure 3), but neither metric predicted the effect as accurately as did the concentration of toluene in the brain at the time the behavior was measured (right most panel of Figure 3). Here it is clear that this single metric provides an accurate and unambiguous estimate of the magnitude of the slowing of the rats’ responses. Similarly, the momentary concentration of the solvent in the brain also best determines its effects on visual function.
What are the implications of this relation between the concentration of a solvent in the brain of a rat and its effects on these esoteric measures of CNS function? Certainly the effects are large and reproducible, and may be relevant to Darel’s neuropathy and Lars’s confusion, but can they address Marcie’s worry about her exposure to gasoline in the car driving home? The rats were exposed to very high concentrations of solvents, whereas Marcie’s exposure was orders of magnitude lower. To explore these questions, my colleagues and I examined published data from other experiments with laboratory animals and human subjects. We wanted to find out how general these effects are, and whether similar dose-effect relations could reveal important information about short-term exposure to solvents at concentrations of concern to Marcie.
To be useful in the context of risk assessment, relations among data sets must be quantitative, so that the likelihood of adverse effects can be estimated, along with its uncertainties. We therefore applied meta-analytical techniques, which enable quantitative comparisons across studies about relations among variables of interest. The first step in such analyses is to survey the existing peer-reviewed literature to determine the scope of existing data that have sufficient information about the exposure to enable application of a PBPK model, and sufficient detail about the measured effects to permit transforming them to a common scale.
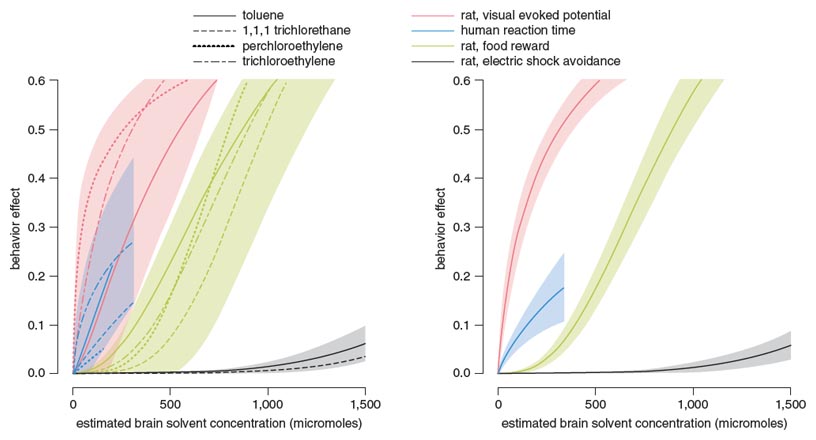
Illustration by Barbara Aulicino.
Sufficient information was found for four solvents (toluene, trichloroethylene, perchloroethylene and 1,1,1-trichloroethane). The effects of these solvents were studied on tests including choice reaction time (CRT) in humans and rats, visual evoked potentials (VEP) in rats, behavior motivated by food reward in rats, and behavior motivated by avoidance or escape from electric shock in rats. All exposure information was converted via PBPK models to the common metric of solvent concentration in the brain at the time that the behavior or physiology was measured, and each effect was converted to a “behavioral effect” scale that ranged from 0 (no effect) to 1.0 (maximum possible effect). Each measure was then plotted against the estimated molar concentration of the solvent in the brain, and each resulting dose-effect curve was fit to a logistic function that quantified the dose-effect relation (see Figure 4, above).
Three important results emerged from this analysis. First, statistically significant differences were apparent across test methods, which aligned with the strength of the incentive involved in performing the task. Specifically, no incentives were associated with the VEPs generated in rats (red curves), because the response was driven directly by the visual inputs from the eye to the brain; humans performing CRT tests (blue curves) were instructed to respond as quickly as possible, but no consequences for slow responding were imposed during the test, and no feedback was given regarding the accuracy of the choice or speed of the response; rats working for food (green curves) received food only for correct responses, so food rewards elicited accurate responding; and rats pressing levers to avoid or escape electric shock (gray curves) were highly motivated by the punishment associated with errors. This pattern indicates that the incentives involved in a test greatly affect the sensitivity of the measure: When the cost of an error is high, the effect of the solvent is greatly attenuated compared to tests involving weak or absent incentives.
The second important result is that the four solvents did not differ significantly in either the maximum effect they produced or the amount of the solvent (in molar units) required to cause a given effect size (potency). For this reason, the data for the four solvents were combined within each type of measurement, yielding pooled dose-effect functions in the right panel of Figure 4 and their associated uncertainty bands (colored shading indicates 95 percent confidence limits around the curve).
The third important result was the lack of difference between rats and humans in their sensitivity to the effects of the solvents. The data from the human reaction time studies fell among the data for the rat studies, not on either side of them. This result gave us confidence that the animal and human experiments were directly comparable, and the rats were appropriate models for assessing effects in humans.
Despite the consistency of these results across solvents and species, and the comforting plausibility of the role of different incentives to modulate the effects of exposure, all of these effects were obtained at high concentrations that would far exceed Marcie’s exposure. How are these high-dose studies relevant to real-world exposures?
To address this question, we examined these effects in relation to the well-known effects of ethanol, which is frequently consumed for its pleasant, anxiety-reducing effects. A great deal is known about the acute effects of ethanol, which closely mirror the acute effects of solvents. One of the effects that these compounds have in common is to slow reaction time. A meta-analysis of the effects of ethanol on reaction time in humans yielded the function shown in the top panel of Figure 5, which plots the size of the effect as a function of blood ethanol concentration (BEC) and its associated confidence limits. The analogous relation for the four combined solvents in Figure 4 is plotted as a function of brain solvent concentration in the bottom, left panel of Figure 5.
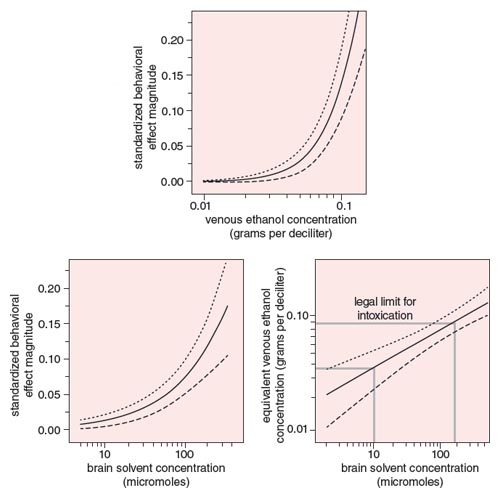
Illustration by Barbara Aulicino.
Because both solvents and ethanol increase reaction time, and because these dose-effect functions are mathematically quantifiable, it is possible to define a function that describes equivalent effects of solvents and ethanol. This dose-equivalence equation is derived algebraically by setting the two dose-effect functions equal to each other and solving for ethanol dose as a function of solvent dose. The resulting function (see Figure 5, right) describes the locus of doses of both ethanol and solvents that produce effects of the same magnitude. For example, equal increases in reaction time will occur at 0.036 gram per deciliter BEC and 10 micromoles of solvent, and at 0.08 grams per deciliter BEC (a typical legal limit of intoxication) and 117 micromoles of solvent.
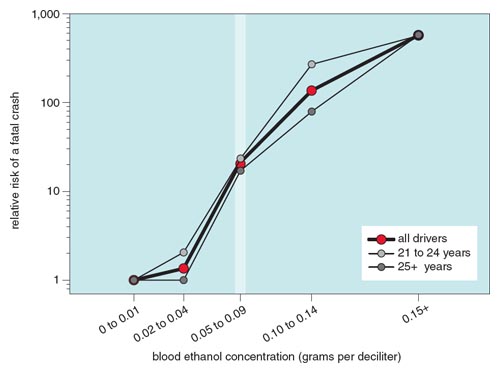
Illustration by Barbara Aulicino.
This relation is more than just a curiosity: It allows us to estimate quantitatively effects of solvents in terms of effects of a chemical for which a great deal of public health information is available. For example, a well-documented effect of ethanol ingestion is the propensity of automobile drivers to lose control of their vehicles. Some of these instances cause fatal crashes. The National Highway Traffic Safety Administration (NHTSA) counts these crashes, and most states in the United States measure the BEC of drivers killed in them. The incidence of single-car fatal crashes in relation to the driver’s BEC were compiled for incidents in 1986 and in 1996. These BECs were then compared to the BECs of drivers who had not crashed, but were stopped randomly at checkpoints during the NHTSA’s National Roadside Surveys of 1986 and 1996. This analysis revealed a soberingly steep relation between BEC and the risk of a fatal crash (see Figure 6). This curve shows that the relative risk of a fatal car crash increases by about 25 times at the legal limit of ethanol intoxication and by about 600 times at very high BECs.
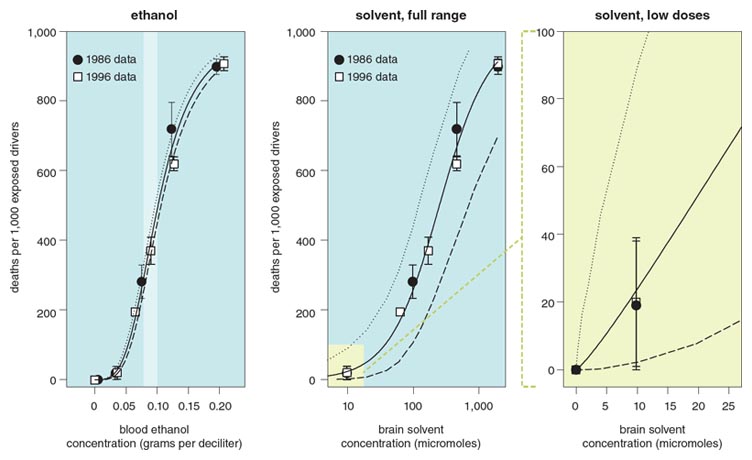
Illustration by Barbara Aulicino.
We then fit a logistic function to this dose-effect relation (see Figure 7, left), averaging values only for drivers 21 years of age and older, and rescaling the effect as the increase in the annual number of fatalities per thousand exposed drivers. Because we know the internal doses of solvents that are equivalent to these internal doses of ethanol (from the dose-equivalence relation in Figure 5), we can now express the increase in the number of fatal car crashes as a function of the internal solvent concentration (see Figure 7, middle). This plot shows the same car crash data in relation to the concentration of a solvent in the brain, with confidence limits around the predicted values that incorporate the uncertainties in both the dose-effect function for solvents and the dose-equivalence relation between ethanol and solvents.
This relation permits us to explore the consequences of exposure to solvents at low concentrations, by focusing on the low end of the curve. The right panel in Figure 7 replots the relation between brain-solvent concentration and fatalities on a linear concentration scale to show that the function starts from zero, indicating that estimates of effects of these low concentrations do not rely on extrapolation beyond the range of the data, but are in fact constrained by measurements at both ends of the range.
What concentrations of an inhaled solvent will increase fatal car crashes by an amount of concern to public health? Of course, the level of concern is a judgment call, but it can be placed in the context of other exposures that clearly do elevate concern for public health. For example, benzene is known to cause leukemia in humans and in animals. The incidence of death from leukemia has been analyzed extensively in a cohort of about 1,700 workers who were exposed to benzene during manufacture of a synthetic packaging material between 1939 and 1960. This “Pliofilm” material was made by dissolving latex in benzene, which then was removed during production of the film, causing exposures of up to 125 parts per million (ppm) at several steps in the process. The incidence of mortality from leukemia was examined across a 45-year period after exposures stopped, to account for the typical 30-year latency period between exposure and death from the disease. These analyses yielded a cumulative incidence of 11 to 12 deaths per thousand exposed workers.
Given that death, either from leukemia or from a fatal collision, is an unacceptable consequence of chemical exposure, and that the 30-year cumulative incidence of mortality from benzene-induced leukemia is about 12 per thousand, how much acute exposure to a solvent would be necessary to increase the 30-year cumulative incidence of mortality from fatal car crashes to that level? To answer this question, we used a human PBPK model to simulate exposures to toluene that would increase its concentrations in the brain to values associated with increased death from fatal car crashes of about 0.5 per year, or 15 per 30 years.
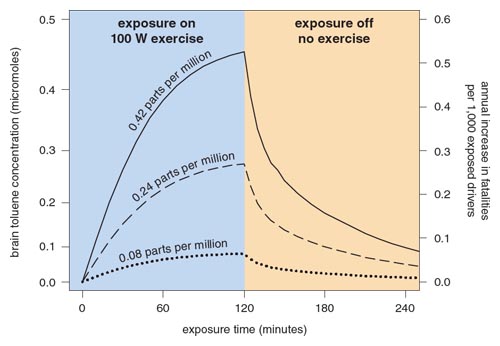
Illustration by Barbara Aulicino.
These simulations demonstrated that it takes surprisingly little toluene to elevate the incidence of fatal car crashes to a level commensurate with the incidence of benzene-induced leukemia. Figure 8 shows the results of simulating a reasonable exposure scenario at three different concentrations of toluene. A healthy person exercising at the rate of a moderate walk (100 watts) and breathing toluene for 2 hours at 0.42 ppm would elevate his or her brain toluene concentration to about 0.45 micromoles. From the function plotted in Figure 8, this concentration corresponds to just over 0.5 annual fatalities per thousand exposed drivers, as shown on the right-hand vertical axis of Figure 8.
This concentration of toluene exceeds estimates of ambient concentrations in the U.S. (about 0.001 ppm), and of estimated personal exposure in the general public, but is lower than the EPA’s Reference Concentration (RfC) for toluene (1.06 ppm), and far lower than typical occupational standards (50 ppm averaged over an 8-hour work day). Note that the RfC (for any chemical) is defined as “an estimate (with uncertainty spanning perhaps an order of magnitude) of a daily inhalation exposure of the human population (including sensitive subgroups) that is likely to be without an appreciable risk of deleterious effects during a lifetime”( http://www.epa.gov/iris/help_ques.htm#whatiris). That is, RfCs are derived from information on the hazard of chronic exposure to a chemical and do not account for potential effects of acute exposure, which our analysis identified as another potential risk.
Are acute exposures to low concentrations of solvents really so dangerous? If so, why does it take such an elaborate analysis to identify the problem? One possibility is that the small increase in deaths (half an additional fatality per year) from exposures at these levels is simply not noticed among all the other factors that influence the statistics. Improvements in the safety of automobiles have reduced the incidence of fatalities, whereas new forms of distraction (for example, use of cell phones while driving) have increased it. Thus this small annual effect may simply be lost in the noise.
On the other hand, the well-known ability of people and animals to compensate for the effects of an intoxicating chemical will reduce the impact of exposure. A decrease in sensitivity to a drug or chemical acquired from experience with the agent is generally known as “tolerance.” Tolerance arises through a number of physiological and psychological processes, and has been shown to develop to ethanol and solvents in very similar ways. Tolerance to these chemicals involves changes both in metabolism (metabolic tolerance) and in the response of the brain to the presence of the chemical (dynamic tolerance). Metabolic tolerance speeds clearance from the body and lowers concentrations of the chemical in the blood and brain. Dynamic tolerance reduces the impact of the chemical that enters the brain, and occurs both acutely (that is, during a single exposure) and more gradually after repeated exposure to the chemical.
Could tolerance mitigate or even eliminate the increased risk of fatal car crashes? One promising statistic in the NHTSA data indicates that adult female “heavy drinkers” actually show a reduced risk of fatal crashes at very low BECs. Perhaps this group has developed sufficient tolerance to the effects of ethanol to eliminate the risk. What is the experimental evidence for this possibility?
In rats, toluene metabolism can be increased four-fold during continuous exposure. However, simulations with our PBPK model showed that this increase would raise the concentration of inhaled toluene needed to elevate brain toluene concentrations to levels that increase the risk of fatal car crashes only to about 0.5 ppm.
In contrast, evidence from many studies of ethanol and several with solvents suggest that the nervous system has a surprising capacity to compensate for impairment of the cognitive and motor functions involved in driving a vehicle that are caused by these chemicals. Dynamic tolerance can develop acutely—during a single episode of intoxication—and after a series of exposures, which involves learning processes. Both of these types of tolerance to the effects of ethanol have been documented in experimental animals and in human volunteers.
In addition to metabolic tolerance, rats that were exposed to toluene for 24 hours developed acute dynamic tolerance. That is, 80 percent more toluene was needed to double their response times at the end of the 24-hour exposure than after 1 hour of exposure. However, simulations revealed that increasing the brain toluene concentration by 80 percent to account for this shift in sensitivity requires air toluene concentrations of just 0.789 ppm.
This value remains below the EPA’s RfC for toluene (1.06 ppm) and lies far below occupational exposure limits. Thus metabolic and acute dynamic tolerance, even from prolonged exposure at very high concentrations, does not increase the detrimental airborne concentration of toluene above concentrations considered “safe.” It is therefore unlikely that occasional exposure to toluene at lower concentrations would yield tolerance sufficient to protect an individual from its effects on risky behaviors like driving.

Photograph by Andrea Thomas, a friend of the author.
However, in addition to the rapid changes in sensitivity to chemicals described above, tolerance is well known to develop with repeated exposure to a drug or chemical. This slower, adaptive process, known as “chronic” tolerance, depends heavily on learning processes. Both humans and rats can learn to overcome many of the behavioral impairments caused by ethanol and solvents; indeed, tolerant rats can perform tasks accurately under conditions of exposure that seriously impair naive ones, and this tolerance can last for weeks. However, for both ethanol and toluene, tolerance develops for the accuracy-reducing effects of intoxication but not the slowing of responses, indicating that the performance of “tolerant” animals is not completely normal. Nevertheless, it may be sufficient to reduce the impact of intoxication on complex behaviors like driving a car.
These simulations necessarily simplify complex real-life situations, which involve many variables that are not considered here. For example, single-car crash fatalities are not the only effect of ethanol, just one that has been linked quantitatively to intoxication. Many other costs are associated with driving errors, including injury, hospitalization, property damage and insurance claims; abuse of ethanol exerts other societal costs as well. In addition, 16–20 year-old drivers—those most likely to be involved in fatal car crashes—were excluded from this analysis. Thus we have probably underestimated both the risk of a car crash from acute solvent intoxication and its costs.
Our simulations were all based on exposure to a single volatile chemical, and it is unlikely that there would be only one solvent in the air. Other solvents have the same effects on behavior, and their effects are probably additive, as would be the combined effect of inhaling a solvent and drinking alcohol.
This analysis does not consider the size of the risk pool, that is, the number of people who are exposed to airborne solvents at concentrations around 0.5 ppm. The EPA’s National Air Toxics Assessment from 2002 (http://www.epa.gov/ttn/atw/nata2002/tables.html) showed that statewide average ambient concentrations of toluene are no greater than 0.0015 ppm, but individual “hot spots” near industrial locations can be much greater. The public health risk of these exposures must include information about the number of people exposed.
From a regulatory perspective, this analysis suggests that setting standards on the basis of chronic exposure protects public health from the long-term hazards of continuous exposure to chemicals but does not consider the potential consequences of acute, episodic exposure to chemicals. Efforts at the EPA are underway to address this concern, and time and support are needed to develop and implement appropriate procedures to do so. The approach of linking effects of toxicants to familiar, well-documented chemicals like ethanol may prove valuable in addressing this problem more generally.
Finally, these considerations illustrate that, in the end, management of risk is not a scientific problem. Decisions about acceptable exposure will ultimately be made balancing tradeoffs among benefits and costs of the chemical to society, including lifestyle, economics, environmental justice, and public and environmental health, as guided by the legislation governing that chemical. Few people are apparently willing to stop driving due to the risk of car crashes, and it is unlikely that awareness of possible effects of airborne solvents will alter this choice. In the end, we all manage our risks for ourselves, assiduously avoiding carcinogens like benzene while ignoring the acute risks inherent in driving. Put simply, nobody wants leukemia, but everyone wants to drive.
The research described in this article has been reviewed by the National Health and Environmental Effects Research Laboratory, U.S. Environmental Protection Agency, and approved for publication. Approval does not signify that the contents reflect the views and policies of the agency, nor does mention of trade names or commercial products constitute endorsement or recommendation for use.
Click "American Scientist" to access home page
American Scientist Comments and Discussion
To discuss our articles or comment on them, please share them and tag American Scientist on social media platforms. Here are links to our profiles on Twitter, Facebook, and LinkedIn.
If we re-share your post, we will moderate comments/discussion following our comments policy.