
This Article From Issue
January-February 2001
Volume 89, Number 1
DOI: 10.1511/2001.14.0
The Door in the Dream: Conversations with Eminent Women in Science. Elga Wasserman. Preface by Rita Colwell. xiv + 254 pp. Joseph Henry Press, 2000. $24.95.
In this study of women elected to the National Academy of Sciences, Elga Wasserman's convincing research strategy demonstrates that as the doors of opportunity have been opened to them, women have made impressive contributions throughout the natural sciences. Because their careers have differed markedly by era, Wasserman groups the women according to whether they were born before 1920, in the '20s, in the '30s or afterward. As we follow the tiny numbers of women who succeeded in doing first-rate science when virtually all institutional doors were closed to them, we can imagine the loss that this exclusion has represented in talent and imagination unused, even as we celebrate the persistence that allowed some women to work unpaid and unacknowledged. Looking at subsequent generations, we can conclude that women are able not only to contribute to science but to excel. At the same time, we are forced to acknowledge the influence of social custom in holding women back and the fact that efforts for change can truly make a difference. Realizing the continuing waste of talent in women who become discouraged at the discrimination they still encounter, and the lack of flexibility in institutions designed to fit the patterns of male life cycles, we can see that much remains to be done.
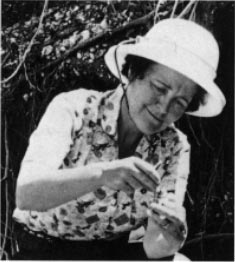
From The Door in the Dream.
Ad Right
Wasserman lets her data speak for her, writing evenhandedly and with restraint. The book consists of individual portraits based on interviews and correspondence. The women interviewed have in common a quality of reticence that veils the experiences of disappointment and rejection hinted at behind the ingenuity required to continue. This is a quiet book; its careful avoidance of appeals to emotion makes it powerful. Each portrait (they range from 3 to 10 pages in length, but most occupy about 5 pages) opens with a sketch of the achievements that brought this woman election to the Academy and then gives her educational, professional and personal history.
It is striking how few of these women accepted the traditional view that they could only do science if they gave up marrying and having children, and how many were able to do their science partly because of supportive spouses. The disappointments were many and the solutions diverse. Women in science suffered the same pressures toward domesticity in the 1950s as did women in the population at large. Fewer of the women admitted to the Academy were born in the '30s than in the '20s, but the number admitted jumps among those born since 1940, who were affected by the women's movement and by civil rights legislation.
The book closes with a group of chapters in which Wasserman summarizes suggestions made by her subjects of ways of "righting the balance" between men and women in the sciences. These include "policies designed to encourage young women to become scientists and to overcome internal barriers rooted in traditional attitudes," for the author recognizes that women themselves have to change to realize their potential. The suggestions also include institutional changes: "family-friendly policies" to assist retention, and policies to equalize opportunities for advancement and inclusion in decision making. One significant conclusion is that in places where the number of women employed reaches a critical mass, as is the case at some biological research laboratories, women are no longer marginalized and become more effective.
For the nonscientist, this is both a useful book for thinking about the shape of scientific careers and an elegant demonstration of an ingenious research strategy; for the scientist, it also suggests a new awareness of effective collegiality. For the citizen, it is an enlightening look at the genuine progress that can be achieved through social legislation, even when much remains to be done: Affirmative action has genuinely increased equity as well as the resources of our society.—Mary Catherine Bateson, Radcliffe Institute for Advanced Studies
American Scientist Comments and Discussion
To discuss our articles or comment on them, please share them and tag American Scientist on social media platforms. Here are links to our profiles on Twitter, Facebook, and LinkedIn.
If we re-share your post, we will moderate comments/discussion following our comments policy.