
This Article From Issue
March-April 2014
Volume 102, Number 2
Page 98
DOI: 10.1511/2014.107.98
On August 14, 1959, the Explorer 6 satellite opened its electronic eye and showed us the Earth in a way it had never been seen before. Even with limited resolution, early satellite views of our planet were a revelation. “When the first images appeared, people would talk about the folds in the Appalachian Mountains,” says James Irons, a veteran scientist at the Earth Sciences Division at NASA’s Goddard Space Flight Center. “There had been textbooks written that described the processes that lead to those formations. For the first time it was possible to observe from great height what people had been talking about for hundreds of years.”
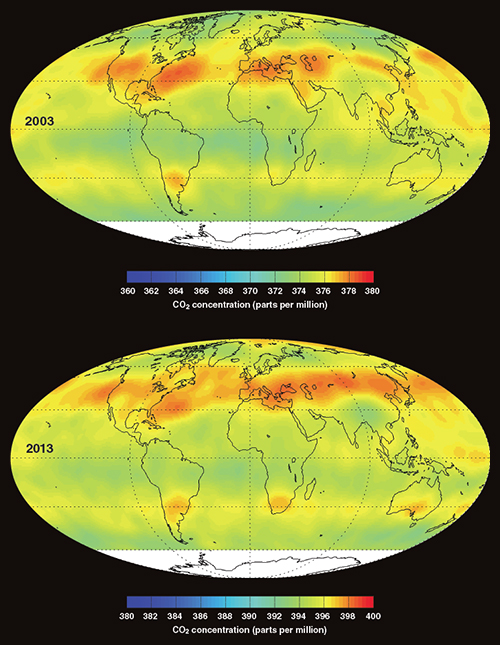
In the half century since, researchers have gained another shift of perspective—not just of space but of time, as satellite sensors document changes to Earth during their repeated orbits around the world. Some of the visible alterations result from geologic events such as volcanic eruptions. Others originate from ecological disturbances created by our species. Many times, the interaction between natural and human action is of interest. The global maps at right, produced by the Atmospheric Infrared Sounder (AIRS) instrument aboard NASA’s Aqua satellite, capture a particularly important interaction.
AIRS measures Earth’s thermal infrared radiation to improve weather forecasting and support climate research. It is most sensitive to long-wavelength infrared emissions from carbon dioxide about 5.5 kilometers above the ground. Since its launch in 2002, AIRS has documented the steady rise in carbon dioxide concentrations, increasing by two parts per million each year, on average. The instrument also detects variations in the amount and location of atmospheric CO2. Concentrations of the gas are often higher over the Northern Hemisphere, where most human-made emissions occur, before it gets transported around the globe.
The Orbiting Carbon Observatory-2, a new NASA satellite to be launched this year, will sample CO2 levels down to the Earth’s surface to pinpoint carbon dioxide sources and sinks. Data from these and other instruments help scientists model atmospheric processes, climate change, and the carbon cycle. “The dynamic of the Earth’s atmosphere is complex and subtle,” says Edward Olsen, a scientist affiliated with the AIRS Project and based at NASA’s Jet Propulsion Laboratory. “What nature solves exactly in real time takes us a long time in computer approximation.”
The longest-running collection of satellite imagery of land on Earth comes from Landsat, an observational research program begun in 1972 and managed jointly by NASA and the U.S. Geological Survey. Matthew Hansen, a geographer and remote sensing scientist at the University of Maryland in College Park, recently used 12 years of Landsat records to map global forest loss and forest gain with the best resolution yet: at 30 meters. From 2000 to 2012, the planet lost 2.3 million square kilometers of forest to deforestation, wildfires, windstorms, and insects. Only 0.08 million square kilometers of forest grew back over the same period. Forest loss in Indonesia, Malaysia, Paraguay, Bolivia, Zambia, Angola, and elsewhere offset reductions in deforestation rates in places such as Brazil.
Two things made the new map possible, Hansen says. One was the U.S. Geological Survey’s 2008 decision to share Landsat data for free. The other was a collaboration with Google, which provided 10,000 computers to apply the data-analysis code that Hansen’s team developed. In four days, the team created a map that would have taken a single computer 15 years to draw, Hansen says. Changes captured in the map could help pinpoint the extent of natural forests, causes of forest disturbances, and rates of forest growth, among other things. “I don’t know how you’d operationally monitor this type of stuff from the ground,” Hansen says, “It’s hugely efficient to have this kind of nadir look.” (To see the map, visit http://earthenginepartners.appspot.com/google.com/science-2013-global-forest.)
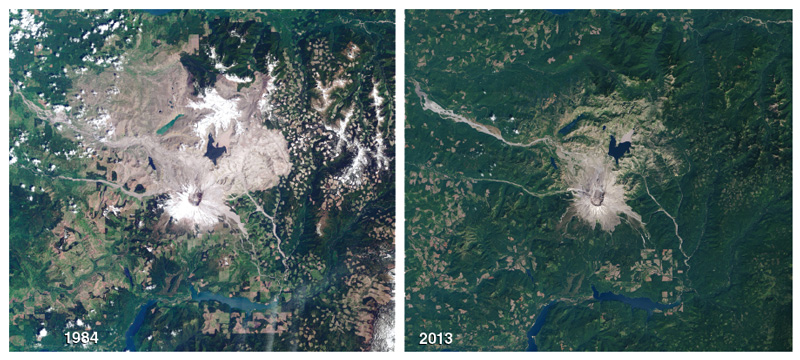
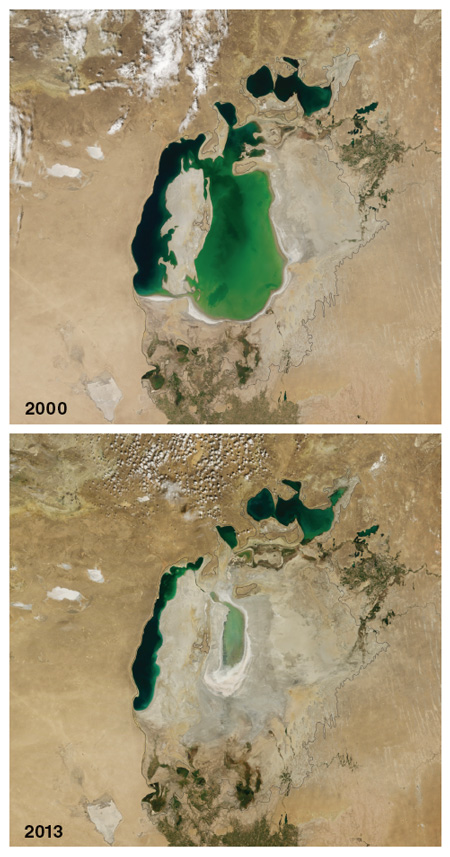
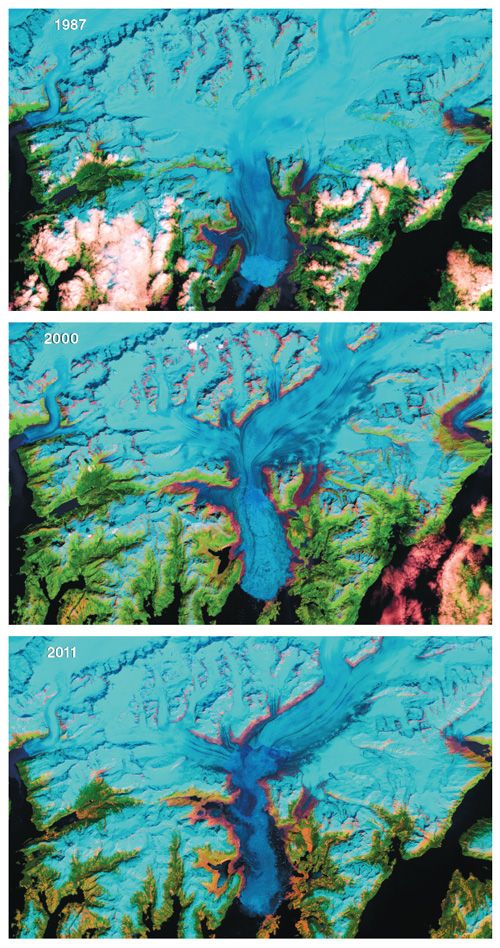
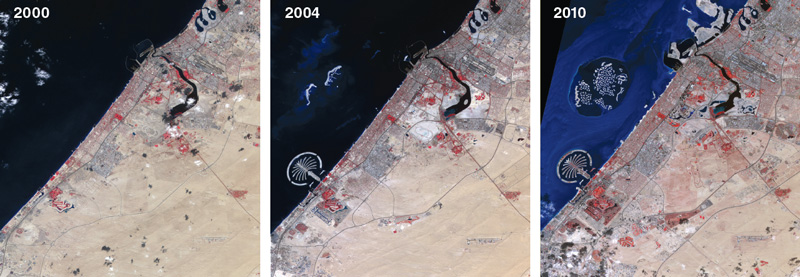
In the images above, satellite images capture urban growth, glacier retreat, and effects from irrigation. Not all the news is gloomy. The eruption of Mount St. Helens in Washington in 1980 destroyed 500 square kilometers of forest. By 2013, Landsat images show encroaching green, where plant life reestablished itself in the blast zone. Just given the chance, the satellites remind us, life creeps back.

American Scientist Comments and Discussion
To discuss our articles or comment on them, please share them and tag American Scientist on social media platforms. Here are links to our profiles on Twitter, Facebook, and LinkedIn.
If we re-share your post, we will moderate comments/discussion following our comments policy.