This Article From Issue
January-February 2012
Volume 100, Number 1
Page 78
DOI: 10.1511/2012.94.78
ORDINARY GENIUSES: Max Delbrück, George Gamow, and the Origins of Genomics and Big Bang Cosmology. Gino Segrè. xxii + 330 pp. Viking, 2011. $27.95.
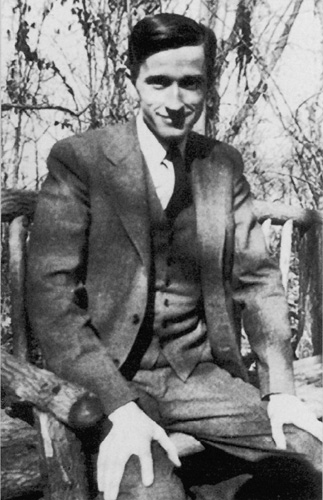
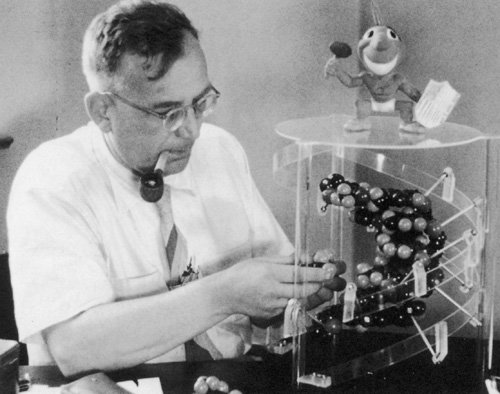
George Gamow, in the epigraph to the preface of his 1947 book One Two Three . . . Infinity, quotes the walrus in Lewis Carroll’s Through the Looking-Glass and declares that for him, too, the time has come to talk of many things: “of atoms, stars, and nebulae, of entropy and genes.” Gino Segrè, who, like Gamow, is a distinguished theoretical physicist and a fine writer (as evidenced by his Faust in Copenhagen), has emulated him by writing about many things in Ordinary Geniuses. The book is a stimulating, authoritative, highly relevant and very accessible account of the origins of Big Bang cosmology and of genomics. It is told through the parallel lives of Max Delbrück (1906–1981) and George Gamow (1904–1968), whose lifelong friendship began in the early 1930s when both were postdoctoral fellows at the Niels Bohr Institute in Copenhagen.

Delbrück, by virtue of his pioneering and seminal studies of the replication of bacterial viruses in their host cells, his charismatic leadership, and the enormous influence he had on those who worked with him, is considered the founder of molecular biology. For his contributions to this field, he and his colleagues Salvador Luria and Alfred Hershey were awarded the Nobel Prize in Physiology or Medicine in 1969.
Gamow, by virtue of his pioneering and seminal contributions to nuclear theory after the introduction of wave mechanics in the 1920s, his early advocacy of the Big Bang theory in cosmology, his generative efforts in deciphering the genetic code, and the deep influence of his popular scientific writings, is remembered as an unconventional, highly original and creative scientist.
In parallel chapters, Segrè sensitively and insightfully narrates chronologically Delbrück’s and Gamow’s personal and professional lives. While doing so, he presents and explains their scientific contributions, the prior works on which they were based, and their present-day importance and relevance.
Delbrück was the youngest of seven children in a very distinguished academic family. His father was a professor of history at Berlin University. He grew up in the Grunewald suburb of Berlin with the families of Max Planck, theologian Adolf von Harnack, and psychiatrist/neurologist Karl Bonhoeffer as close neighbors. While he attended Göttingen University from 1926 to 1929, Delbrück’s early interest in astronomy and mathematics became transformed into a commitment to theoretical physics. He there wrote a doctoral thesis under Walter Heitler on the binding energy of the Li2 molecule and thereafter spent some time in Bristol working with John Lennard-Jones on quantum chemistry.
The award of a Rockefeller fellowship in 1931 became a transformative experience for Delbrück. In February 1931 he went to Copenhagen, where he spent six months working under the influence of Niels Bohr. While there, he roomed with Gamow, and the two of them collaborated on a nuclear physics project. Delbrück then went to Zurich, where he spent the final six months of his fellowship working with Wolfgang Pauli. Bohr and Pauli profoundly influenced him. He incorporated Pauli’s deep sense of integrity, his unflagging dedication to the highest standards of scientific investigation, his intolerance of intellectual pretense and his unsettling frankness. Pauli’s “Not even wrong” became translated into Delbrück’s “I don’t believe a word of it”—his frequent response when told of some new experimental result or theoretical model. Bohr’s complementarity principle and his attempts to extend its applicability beyond the atomic domain—in particular, to biology and consciousness—led Delbrück to study the relation of atomic physics and biology. His interaction with Bohr, and his lack of creativity in comparison with Hans Bethe, Felix Bloch, Gamow, Lev Landau, Rudolf Peierls, Victor Weisskopf and other off-the-scale theorists of his generation, eventually made him decide to become a biologist.
In 1933, rather than becoming Pauli’s assistant, Delbrück accepted the position of house theoretician in Lise Meitner’s nuclear physics group at the Kaiser Wilhelm Institute in Berlin, because the job would allow him to devote ample time to studying biology. While in Berlin, he organized a study group in biology and collaborated with Nikolai W. Timoféeff-Ressovsky and Karl G. Zimmer in writing an important paper on the nature of gene mutation and gene structure. In it, Delbrück used his knowledge of the quantum-mechanical description of molecular structure as the basis for a model of the gene that was to account both for its remarkable stability in its cellular environment and for the mutational consequences of its exposure to x-rays. It was reading this paper that led Erwin Schrödinger to write his influential 1945 book What Is Life?: The Physical Aspect of the Living Cell.
In 1937, because of the political situation in Nazi Germany, Delbrück’s employment in Berlin came to an end, and he accepted a research position in Thomas Hunt Morgan’s fly room at Caltech. It was there that he first learned of bacterial viruses from Emory L. Ellis and collaborated with him on an influential article, “The Growth of Bacteriophage,” published in 1939. Summer visits to Cold Spring Harbor further integrated Delbrück into the American genetics community. In 1940 he went to Vanderbilt University as an instructor in physics but continued doing research on phages. Working with Luria and Hershey on various aspects of mutations in bacteriophages, Delbrück formulated and carried out the mathematization of the initial phase of molecular biology. In 1947 he accepted George Beadle’s invitation to return to Caltech as a professor of biology.
The distinguished geneticist William Hayes, in his National Academy of Sciences biographical memoir of Delbrück, succinctly characterized him as follows:
A man of rare intellectual ability, and clarity of thought and perception, he excelled in theoretical physics, biology, and philosophy, and possessed a deep knowledge and appreciation of the arts. . . .
Above all, Max was a born leader whose Socratic influence on those who worked with him was enormous, whose rare praise was something to be coveted and remembered, and whose criticism was welcomed with respect. . . . On a personal level he engendered in the minds of his friends and colleagues a deep respect and affection.
Segrè has convincingly corroborated this assessment by detailing Delbrück’s scientific life.

Similarly, Segrè has insightfully and lovingly narrated the life of George Gamow: his growing up in Odessa; the hard years of the Russian Revolution; his membership in the “Jazz Band,” a remarkable quartet (the other members were Dmitri Ivanenko, Lev Landau and Matvei Bronstein) of young men in Leningrad in the mid-1920s who were passionately studying the development of quantum mechanics; his stays in Europe, first in Copenhagen with Bohr and then in Cambridge with Ernest Rutherford; his attempts to escape the Soviet Union after returning there; his acceptance in 1934 of a professorship at George Washington University; his role in establishing the annual Washington Conferences on Theoretical Physics; and his eventual acceptance in 1956 of a professorship at the University of Colorado at Boulder. And in the process of narrating Gamow’s personal and professional life, Segrè also tells us about Gamow’s seminal contribution to the theory of alpha-particle decay, his influential “liquid drop” model of the nucleus, his attempts to explain nucleogenesis in a Big Theory of cosmogenesis, his important post–World War II work with Ralph Alpher and Robert Herman on the consequences of including radiation in a Big Bang model (predictions eventually corroborated by Arno Penzias and Robert Wilson, and by Robert Dicke and his collaborators, with the discovery of the cosmic microwave background radiation), and his generative contributions to the decipherment of the genetic code.
The focus of Segrè’s book is on scientific matters and concrete results and accomplishments. I would have liked to learn a little more about Delbrück’s and Gamow’s political views and their respective mathematical abilities, and more about their character traits and the metaphysical assumptions that guided them—I’m curious about what allowed Gamow to be so open to the world and what constrained Delbrück to cling throughout his life to the dialectical aspect of Bohr’s complementarity principle, loosely interpreted, as applied to biology. But this in no way detracts from Segrè’s truly impressive accomplishment in informing the wider public of the great and important scientific advances achieved by these men.
Delbrück, Schrödinger and Gamow’s contributions to, and influence on, molecular biology derived in part from their having been trained as physicists. Schrödinger’s What is Life? and Delbrück’s annual phage lectures at Cold Spring Harbor from 1945 on were responsible for attracting a large number of young physicists to molecular biology. Today, once again advances in biology, and the funding available in the field, are attracting a large number of young physicists to genomics and to molecular and evolutionary biology. I hope that Segrè will be challenged to write an equally lucid and enlightening book about this development.
Silvan S. Schweber is professor of physics and Richard Koret Professor in the History of Ideas, emeritus, at Brandeis University. He is the author of, among other books, QED and the Men Who Made It (1994) and In the Shadow of the Bomb: Bethe, Oppenheimer, and the Moral Responsibility of the Scientist (2000), both from Princeton University Press, and Einstein and Oppenheimer: The Meaning of Genius (Harvard University Press, 2008).

American Scientist Comments and Discussion
To discuss our articles or comment on them, please share them and tag American Scientist on social media platforms. Here are links to our profiles on Twitter, Facebook, and LinkedIn.
If we re-share your post, we will moderate comments/discussion following our comments policy.