The Water Cycle on Overdrive
By Adam Milewski
The movement of Earth’s water through atmosphere, surface, and underground is accelerating as the climate changes.
The movement of Earth’s water through atmosphere, surface, and underground is accelerating as the climate changes.

Drought, the melting of glaciers, and extreme precipitation events are just some of the headlines dominating the news as the world deals with a new hydrologic normal. Worldwide impacts on weather events, agriculture, and freshwater resources are already taking place, and will grow more intense in the future at the climate changes. Even the increasing rotational speed of Earth itself, shortening our 24-hour day, may be attributable to the intensification of the water cycle. Determining how bad these impacts will be and how they will play out depends on difficult calculations of water circulation in a warming world. Recent modeling that I contributed to, in collaboration with my coworkers at the University of Georgia, Fabian Zowam and David F. Richards, IV, is clarifying the details and offering a look at what we need to prepare for in a new climate.
Population growth is increasing the demand for groundwater, while the effects of climate change and the intensification of the water cycle make the status of the planet’s freshwater resources critical. More than one-third of the water that humans use worldwide comes from underground. Warmer temperatures increase terrestrial evaporation, which brings more of the world’s water into the atmosphere, reduces groundwater recharge, and thus potentially hinders the amount of water refilling underground aquifers.
In 2015, Wen-Ying Wu of the University of Texas at Austin and her colleagues concluded that the intensification of water’s circulation through the atmosphere, land surface, and ground can cause changes in groundwater storage and sustainability within aquifers. Specifically, they noted that increased evapotranspiration—when water enters the atmosphere—and decreased snowmelt reduce inputs and increase outputs to result in depleted groundwater. The situation is exacerbated by the need for groundwater pumping for residential requirements, such as drinking water and irrigation.
Water cycle intensity has become a key tool in evaluating changes in water availability.
The severity of this dilemma varies by region. In an effort to ensure its groundwater sustainability, California passed the Sustainable Groundwater Management Act (SGMA) in 2014. Enacted after severe overpumping in the third year of a record drought, the policy requires the development of plans at the local level for groundwater basins that achieve sustainability within 20 years.
Storms, droughts, erosion, and the uncertainty surrounding these phenomena are all affected by changes in the water cycle, which in turn affect agriculture. Climate change can also intensify crop damage and influence the effectiveness of agrichemicals. Research in 2020 by Richard Allan of the University of Reading in England found increased atmospheric changes in moisture have resulted in heavier rainfall, more intense wet and dry seasons, and more extreme weather events due to higher levels of water cycling between the surface and atmosphere.
Precipitation, evaporation, and other physical processes redistribute water into the atmosphere and different reservoirs such as lakes, rivers, and groundwater. Solar radiation heats water and causes it to evaporate as vapor, which cools as it rises. Eventually this vapor falls as precipitation, and the cycle continues once again. This sequence has been accelerating in recent times due to climate change, which has implications for agricultural systems, weather events, and freshwater resources worldwide. In recent years, climate scientists and hydrogeologists have developed increasingly effective ways of examining this complicated interplay.
Research shows that greenhouse gas emissions intensify the water cycle, cause an increase in global temperature, and affect primary hydrologic processes. Circulation rates, however, vary for different climate zones, causing uneven changes in water.
Extreme weather events in California led Jin-Ho Yoon of the Pacific Northwest National Laboratory and his colleagues in 2015 to analyze multiple climate projections of precipitation and evapotranspiration made using the Community Earth System Model, version 1 (CESM1). One projection showed a gradual increase in California’s precipitation, accompanied by increasing surface warming from 1990 through 2070. They also found that “water cycle extremes,” defined as the occurrence of both excessively wet and dry events within a year, could increase considerably in California. They estimated that extreme dry events will increase from about 5 during 1930–1939 to about 10 during 2070–2079, and extreme wet events will increase from about 4 during 1930–1939 to approximately 15 during 2070–2079. These projections would mean more and longer pronounced drought events and a decrease in available water resources, as well as more frequent and extreme precipitation events that affect infrastructure, food production, and contamination. This research outlines the challenges ahead and provides scientists an opportunity to quantify the potential impacts.
In a 2019 paper in the Journal of Hydrology, Thomas G. Huntington, Peter Weiskel, David M. Wolock, and Gregory J. McCabe of the United States Geological Survey developed a new framework for quantifying the intensity of the terrestrial water cycle. This indicator, referred to as water cycle intensity, is the sum of precipitation (a groundwater input) and actual evapotranspiration (a groundwater output) averaged over a time period of interest. Their analysis of water cycle intensity in the United States found that it increased over the period of investigation (1945–1974 and 1985–2014), a shift that was largely attributed to increases in precipitation overall in the contiguous United States. However, this intensified water cycle then resulted in decreased precipitation, runoff, and soil moisture storage in certain areas, specifically in the West and Southeast.
The complexity of this phenomenon is further highlighted by a counterintuitive pattern the model showed: An intensification of the water cycle, brought on by an increase in precipitation overall, ultimately led to a decrease in precipitation in specific areas of the country. Since this paper’s publication, the authors’ framework for quantifying changes in spatial and temporal water cycle intensity has become a key tool in evaluating changes in water availability.
Recently, my collaborators and I developed a model that applied a satellite remote sensing–based approach to the existing water cycle intensity framework, which we presented in December 2021 at the American Geophysical Union meeting. With this approach, we looked at more recent and refined satellite data. Using data from 2001 to 2019 from NASA and the Harvard Dataverse repository, our results show average cycling intensities over that time frame generally decreased moving westward. The southeastern United States, with intensities of more than 4,000 millimeters per year in parts of Louisiana and Florida, showed the highest acceleration rates. The effects of this acceleration on people living in those areas may include increased land loss, negative impacts on fisheries, potential loss of wells, and a growing Gulf dead zone. The most substantial increase in water cycle intensities between two separate multiannual periods (2001–2009 and 2010–2019) was in the West, even though this region had lower water cycle intensity averages (2001–2019). This method can now be applied to groundwater reservoirs worldwide and, more specifically, to data-scarce environments. It also can help identify areas of groundwater risk and vulnerability.
Many challenges arise when assessing changes in groundwater resources at the regional and continental scales. Through this method, we have developed a better sense of how water cycle intensity is related to groundwater recharge, so that now we can work around these limitations. Although positive correlations between water cycle intensity and groundwater recharge dominate the contiguous United States, the strongest relationships (R2≥0.75) occurred along the coasts of Washington, Oregon, and California. This research further suggests that groundwater recharge is correlated with differences in water cycle intensity. (See image below.)
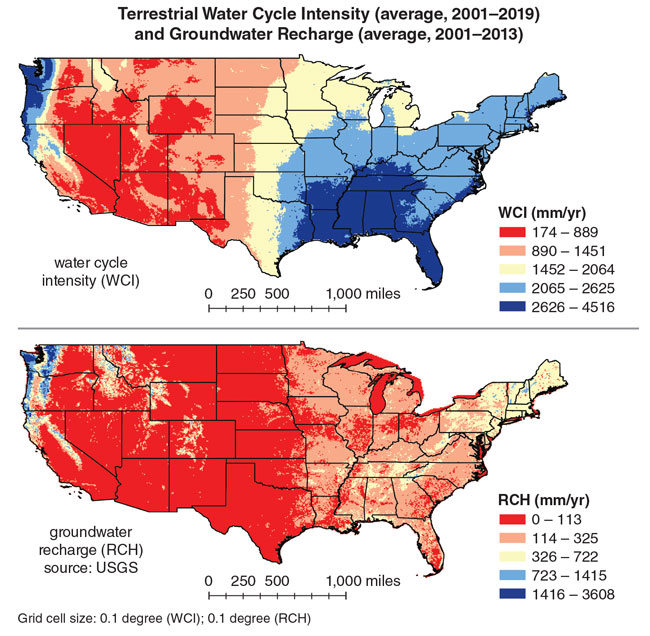
Image courtesy of the author.
Increases in water cycle intensity can increase groundwater recharge, mostly due to increased precipitation. Areas of water cycle deceleration, such as parts of California and the Southeast, generally have lower groundwater replenishment and are more prone to drought. This process is complicated, however, and there are exceptions to this pattern in areas with higher evapotranspiration, such as the Southwest. Lastly, results show that annual El Niño–Southern Oscillation events are intensifying the water cycle even further in the southwestern and southeastern United States, while in other regions this acceleration is more representative of anthropogenic causes.
Next steps will focus on finding links between the factors under our control (such as industry, lifestyle, and technology) and their effects on the water cycle intensification that is occurring at present. Our model is a step in that direction because it helps answer questions concerning regional water availability, urban growth, and sustaining productive agriculture.
Click "American Scientist" to access home page

American Scientist Comments and Discussion
To discuss our articles or comment on them, please share them and tag American Scientist on social media platforms. Here are links to our profiles on Twitter, Facebook, and LinkedIn.
If we re-share your post, we will moderate comments/discussion following our comments policy.