The Spectrum of Riemannium
By Brian Hayes
Tracing an intriguing link between number theory and nuclear physics
Tracing an intriguing link between number theory and nuclear physics

DOI: 10.1511/2003.26.296
The year: 1972. The scene: Afternoon tea in Fuld Hall at the Institute for Advanced Study. The camera pans around the Common Room, passing by several Princetonians in tweeds and corduroys, then zooms in on Hugh Montgomery, boyish Midwestern number theorist with sideburns. He has just been introduced to Freeman Dyson, dapper British physicist.
Dyson: So tell me, Montgomery, what have you been up to?
Montgomery: Well, lately I've been looking into the distribution of the zeros of the Riemann zeta function.
Dyson: Yes? And?
Montgomery: It seems the two-point correlations go as.... (turning to write on a nearby blackboard):

Dyson: Extraordinary! Do you realize that's the pair-correlation function for the eigenvalues of a random Hermitian matrix? It's also a model of the energy levels in a heavy nucleus—say U-238.
I present this anecdote in cinematic form because I expect to see it on the big screen someday, now that mathematicians outgun cowboys and secret agents at the box office. Besides, the screenplay genre gives me license to dramatize and embellish a little. By the time the movie opens at your local multiplex, the script doctors will have taken further liberties with the facts. For example, the equation for nuclear energy levels will have become the secret formula of the atomic bomb.
Even without Hollywood hyperbole, however, the chance encounter of Montgomery and Dyson was a genuinely dramatic moment. Their conversation revealed an unsuspected connection between areas of mathematics and physics that had seemed remote. Why should the same equation describe both the structure of an atomic nucleus and a sequence at the heart of number theory? And what do random matrices have to do with either of those realms? In recent years, the plot has thickened further, as random matrices have turned up in other unlikely places, such as games of solitaire, one-dimensional gases and chaotic quantum systems. Is it all just a cosmic coincidence, or is there something going on behind the scenes?
How things distribute themselves in space or time or along some more abstract dimension is a question that comes up in all the sciences. An astronomer wants to know how galaxies are scattered around the universe; a biologist might study the distribution of genes along a strand of chromatin; a seismologist records the temporal pattern of earthquakes; a mathematician ponders the sprinkling of prime numbers among the integers. Here I shall consider only discrete, one-dimensional distributions, where the positions of items can be plotted along a line.
Brian Hayes
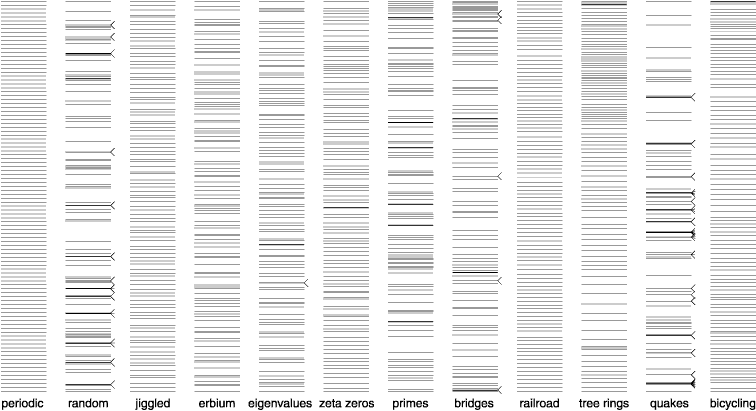
Figure 1 shows samples of several such distributions, some of them mathematically defined and others derived from measurements or observations. All of the samples have been scaled so that exactly 100 levels fit in the space allotted. Thus the mean distance between levels is the same in all cases, but the patterns are nonetheless quite diverse. For example, the earthquake series is highly clustered, which surely reflects some geophysical mechanism. The lower-frequency fluctuations of tree-ring data probably have both biological and climatological causes. And it's anyone's guess how to explain the locations of bridges recorded while driving along a stretch of Interstate highway.
In analyzing patterns of this kind, there is seldom much hope of predicting the positions of individual elements in a series. The aim is statistical understanding—a description of a typical pattern rather than a specific one. I shall focus on two statistical measures: nearest-neighbor spacings and the two-point correlation function.
The simplest of all distributions is a periodic one. Think of a picket fence or the monotonous ticking of a clock: All the intervals between elements of the series are exactly the same. The obvious counterpoint to such a repetitive pattern is a totally random one. And between these extremes of order and disorder there are various intermediate possibilities, such as a "jiggled" picket fence, where periodic levels have been randomly displaced by a small amount.
Brian Hayes
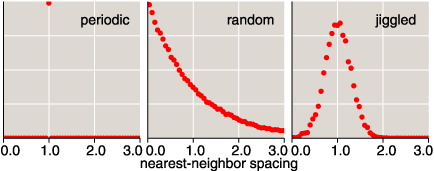
A graph of nearest-neighbor spacings readily distinguishes among the periodic, random and jiggled patterns (see Figure 2). For the periodic distribution, the graph is a single point: All the spacings are the same. The nearest-neighbor spectrum of the random distribution is more interesting: The frequency of any spacing x is proportional to e-x. This negative-exponential law implies that the smallest spacing between levels is the likeliest. The jiggled pattern yields a bell-shaped curve, suggesting that the nearest-neighbor intervals have a Gaussian distribution.
Brian Hayes
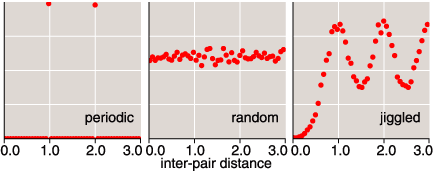
The pair-correlation function mentioned by Montgomery and Dyson captures some of the same information as the nearest-neighbor spectrum, but it is calculated differently. For each distance x, the correlation function counts how many pairs of levels are separated by x, whether or not those levels are nearest neighbors. The pair-correlation function for a random distribution is flat, since all intervals are equally likely. As the distribution becomes more orderly, the pair-correlation function develops humps and ripples; for the periodic distribution it is a series of sharp spikes.
Among the spectra in Figure 1 is a series of 100 energy levels of an atomic nucleus, measured 30 years ago with great finesse by H. I. Liou and James Rainwater and their colleagues at Columbia University. The nucleus in question is that of the rare-earth element erbium-166. A glance at the spectrum reveals no obvious patterns; nevertheless, the texture is quite different from that of a purely random distribution. In particular, the erbium spectrum has fewer closely spaced levels than a random sequence would. It's as if the nuclear energy levels come equipped with springs to keep them apart. This phenomenon of "level repulsion" is characteristic of all heavy nuclei.
What kind of mathematical structure could account for such a spectrum? This is where those eigenvalues of random Hermitian matrices enter the picture. They were proposed for this purpose in the 1950s by the physicist Eugene P. Wigner. As it happens, Wigner was another Princetonian, who could therefore make an appearance in our movie. Let him be the kindly professor who explains things to a dull student, while the audience nods knowingly. The dialogue might go like this:
Wigner: Come, we'll make ourselves a random Hermitian matrix. We start with a square array, like a chessboard, and in each little square we put a random number....
Student: What kind of number? Real? Complex?
Wigner: It works with either, but real is easier.
Student: And what kind of random? Do we take them from a uniform distribution, a Gaussian...?
Wigner: Customarily Gaussian with mean 0 and variance 1, but this is not critical. What is critical is that the matrix be Hermitian. A Hermitian matrix—it's named for the French mathematician Charles Hermite—has a special symmetry. The main diagonal, running from the upper left to the lower right, acts as a kind of mirror, so that all the elements in the upper triangle are reflected in the lower triangle.
Student: Then the matrix isn't really random, is it?
Wigner: If you insist, we'll call it half-random. We fill the upper half with random numbers, and then we copy them into the lower half. So now we have our random Hermitian matrix M, and when we calculate its eigenvalues....
Student: But how do I do that?
Wigner: You start up Matlab and you type "eig(M)"!
Eigenvalues go by many names, all of them equally opaque: characteristic values, latent roots, the spectrum of a matrix. Definitions, too, are more numerous than helpful. For present purposes it seems best to say that every N-by-N matrix is associated with an Nth-degree polynomial equation, and the eigenvalues are the roots of this equation. There are N of them. In general, the eigenvalues can be complex numbers, even when the elements of the matrix are real, but the symmetry of a Hermitian matrix ensures that all the eigenvalues will be real. Hence they can be sorted from smallest to largest and arranged along a line, like energy levels. In this configuration they look a lot like the spectrum of a heavy nucleus. Of course the eigenvalues do not match any particular nuclear spectrum level-for-level, but statistically the resemblance is strong.
When I first heard of the random-matrix conjecture in nuclear physics, what surprised me most was not that it might be true but that anyone would ever have stumbled on it. But Wigner's idea was not just a wild guess. In Werner Heisenberg's formulation of quantum mechanics, the internal state of an atom or a nucleus is represented by a Hermitian matrix whose eigenvalues are the energy levels of the spectrum. If we knew the entries in all the columns and rows of this matrix, we could calculate the spectrum exactly. Of course we don't have that knowledge, but Wigner's conjecture suggests that the statistics of the spectrum are not terribly sensitive to the specific matrix elements. Thus if we just choose a typical matrix—a large one with elements selected according to a certain statistical rule—the predictions should be approximately correct. The predictions of the model were later worked out more precisely by Dyson and others.
So much for nuclear physics; what about number theory and the zeta function?
The most celebrated sequence in number theory is that of the primes: 2, 3, 5, 7, 11.... The overall trend in this series is well known. In the neighborhood of any large integer x, the proportion of numbers that are prime is approximately 1/log x, which implies that although the primes go on forever, they get sparser as you climb farther out on the number line. Superimposed on this gradual thinning of the crop are smaller-scale fluctuations that are harder to understand in detail. The sequence of primes looks quite random and erratic, and yet it cannot possibly have the same nearest-neighbor statistics as a truly random spectrum. The nearest that two primes can approach each other (except in one anomalous case) is 2. Pairs that have this minimum spacing, such as 29 and 31, are called twin primes. No one knows whether there are infinitely many of them.
In addition to directly exploring the primes, mathematicians have taken a roundabout approach to understanding their distribution by way of the Riemann zeta function. This function, although named both by and for Bernhard Riemann, was first studied in the 18th century by Leonhard Euler, who defined it as a sum over all the natural numbers:

In other words, take each natural number n from 1 to infinity, raise it to the power s, take the reciprocal, and add up the entire series. The sum is finite whenever s is greater than 1. For example, Euler showed that z(2) is equal to p2/6, or about 1.645:

Euler also proved a remarkable identity, equating the summation formula, with its one term for each natural number, to a product formula that has one term for each prime. This second definition states:

The recipe in this case is to take each prime p from 2 to infinity, raise it to the power s, then after some further arithmetic multiply together the terms for all p. The result is the same as that of the summation. This connection between a sum over all integers and a product over all primes was a hint that the zeta function might have something to say about the distribution of primes among the integers, and in fact the two series are intimately related.
Brian Hayes; data for this graph were supplied by Andrew M. Odlyzko
Riemann's contribution, in 1859, was to extend the domain of the zeta function so that it applies not just when s is a real number greater than 1 but when s is any number—positive or negative, real or complex—with the single exception of numbers whose real part is equal to 1. Over much of the complex plane the function turns out to be wildly oscillatory, crossing from positive to negative values infinitely often. The crossing points, where ζ(s)=0, are called the zeros of the zeta function. There is an infinite series of them along the negative real axis, but these are not looked upon with great interest. Riemann called attention to a different infinite series of zeros lying above and below the real axis in a vertical strip of the complex plane that includes all numbers whose real part is between 0 and 1. Riemann calculated the locations of the first three of these zeros and found that they lie right in the middle of the strip, on the "critical line" with real coordinate 1/2. On the basis of this evidence, plus incredible intuition, he conjectured that all the complex zeros are on the critical line. This is the Riemann hypothesis, widely regarded as the juiciest prize plum in all of contemporary mathematics.
In the years since Riemann located the first three zeta zeros, quite a few more have been found. A cooperative computing network called ZetaGrid, organized by Sebastian Wedeniwski of IBM, has checked 385 billion of them. So far, every one is on the critical line. There's even a proof that infinitely many lie on the line, but what's wanted is a proof that none lie anywhere else. That goal remains out of reach.
In the meantime, other aspects of the zeta zeros have come under scrutiny. Assuming that all the zeros are indeed on the critical line, what is their distribution along that line? How does their density vary as a function of the "height," T, above or below the real axis?
As with the primes, the overall trend in the abundance of zeta zeros is known. The trend goes the opposite way: Whereas primes get rarer as they get larger, the zeta zeros crowd together with increasing height. The number of zeros in the neighborhood of height T is proportional to log T, signifying a slow increase. But, again, the trend is not smooth, and the details of the fluctuations are all-important. Gaps and clumps in the series of zeta zeros encode information about corresponding features in the sequence of primes.
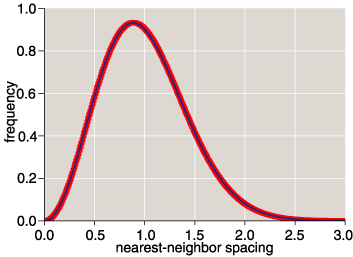
Montgomery's work on the pair-correlation function of the zeta zeros was a major step toward understanding the statistics of the fluctuations. And the encounter in Fuld Hall, when it emerged that Montgomery's correlation formula is the same as that for eigenvalues of random matrices, ignited further interest. The correlation function implies level repulsion among the zeros just as it does in the nucleus, producing a deficiency of closely spaced zeros.
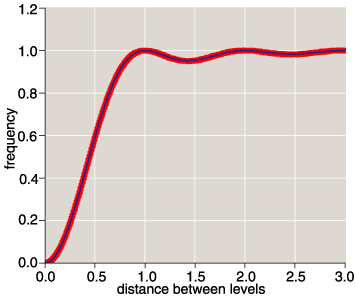
Brian Hayes; data for this graph were supplied by Andrew M. Odlyzko
Montgomery's result is not a theorem; his proof of it is contingent on the truth of the Riemann Hypothesis. But the accuracy of the correlation function can be tested by comparing the theoretical prediction with computed values of zeta zeros. Over the past 20 years Andrew M. Odlyzko, now at the University of Minnesota, has taken the computation of zeta zeros to heroic heights in order to perform such tests. For this purpose it is not enough to verify that the zeros lie on the critical line; the program must accurately measure the height of each zero along that line, which is a more demanding task. One of Odlyzko's early papers was titled "The 1020th zero of the Riemann zeta function and 175 million of its neighbors." Since then he has gone on to compute even longer series of consecutive zeros at even greater heights, now reaching the neighborhood of the 1023rd zero. The agreement between predicted and measured correlations is striking, and it gets better and better with increasing height.
Is it all just a fluke, this apparent link between matrix eigenvalues, nuclear physics and zeta zeros? It could be, although a universe with such chance coincidences in its fabric might be considered even stranger than one with mysterious causal connections.
Another possible explanation is that the statistical distribution seen in these three cases (and in several others I have not discussed) is simply a very common way for things to organize themselves. There is an analogy here with the Gaussian distribution, which turns up everywhere in nature because many different processes all lead to it. Whenever multiple independent contributions are summed up, the outcome is the familiar bell-shaped Gaussian curve: This observation is the essence of the Central Limit Theorem. Maybe some similar principle makes the eigenvalue distribution ubiquitous. Thus for Montgomery and Dyson to come up with the same correlation function would not be such a long shot after all.
Still another view is that the zeros of the zeta function really do represent a spectrum—a series of energy levels just like those of the erbium nucleus, but generated by the mathematical element Riemannium. This idea traces back to David Hilbert and George Pólya, who both suggested (independently) that the zeros of the zeta function might be the eigenvalues of some unknown Hermitian "operator." An operator is a mathematical concept that seems on first acquaintance rather different from a matrix—it is a function that applies to functions—but operators too have eigenvalues, and a Hermitian operator has symmetries that make all the eigenvalues real numbers, just as in the case of a Hermitian matrix.
If the Hilbert-Pólya thesis is correct, then random-matrix methods succeed in number theory for essentially the same reason they work in nuclear physics—because the detailed structure of a large matrix (or operator) is less important than its global symmetries, so that any typical matrix with the right symmetries will produce statistically similar results. Behind these approximations stands some unique Hermitian operator, which determines the exact position of all the Riemann zeros and hence the distribution of the primes.
Is that universal operator really out there, waiting to be discovered? Will it ever be identified? For the answers to those questions you'll have to see the movie. I don't want to give away the ending.
© Brian Hayes
I owe the title of this column to Oriol Bohigas, who mentioned "the spectrum of Riemannium" in a talk at the Mathematical Sciences Research Institute in Berkeley, where I was an embedded journalist in 1999. At that time I also benefitted from discussions with Alan Edelman, Peter Forrester, Andrew Odlyzko, Craig Tracy and others.
Click "American Scientist" to access home page
American Scientist Comments and Discussion
To discuss our articles or comment on them, please share them and tag American Scientist on social media platforms. Here are links to our profiles on Twitter, Facebook, and LinkedIn.
If we re-share your post, we will moderate comments/discussion following our comments policy.