Twisted Math and Beautiful Geometry
By Eli Maor, Eugen Jost
Four families of equations expose the hidden aesthetic of bicycle wheels, falling bodies, rhythmic planets, and mathematics itself.
Four families of equations expose the hidden aesthetic of bicycle wheels, falling bodies, rhythmic planets, and mathematics itself.

DOI: 10.1511/2014.107.140
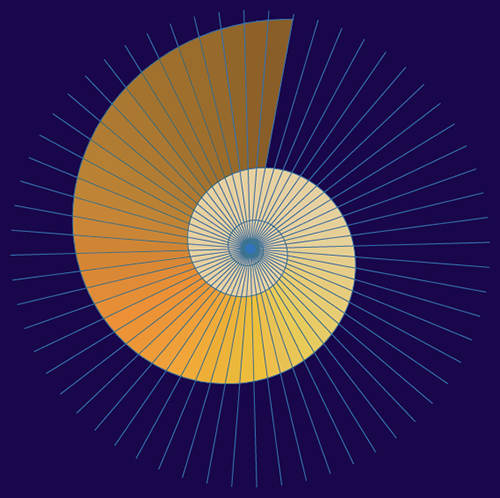
Of the numerous mathematical curves we encounter in art, geometry, and nature, perhaps none can match the exquisite elegance of the logarithmic spiral. This famous curve appears, with remarkable precision, in the shape of a nautilus shell, in the horns of an antelope, and in the seed arrangements of a sunflower. It is also the ornamental motif of countless artistic designs, from antiquity to modern times. It was a favorite curve of the Dutch artist M. C. Escher (1898–1972), who used it in some of his most beautiful works, such as Path of Life II.
Geometric artwork produced by Eugen Jost.
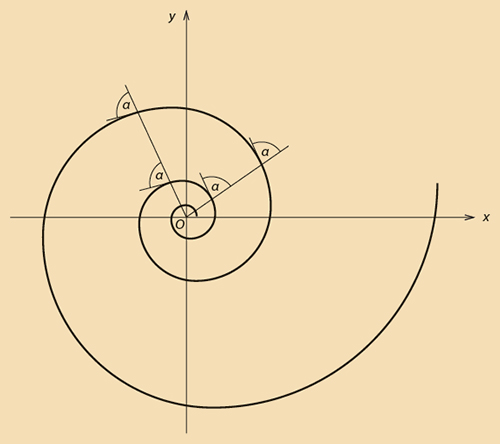
The logarithmic spiral is best described by its polar equation, written in the form r = eaθ, where r is the distance from the spiral’s center O (the “pole”) to any point P on the curve, θ is the angle between line OP and the x-axis, a is a constant that determines the spiral’s rate of growth, and e is the base of natural logarithms. Put differently, if we increase θ arithmetically (that is, in equal amounts), r will increase geometrically (in a constant ratio).
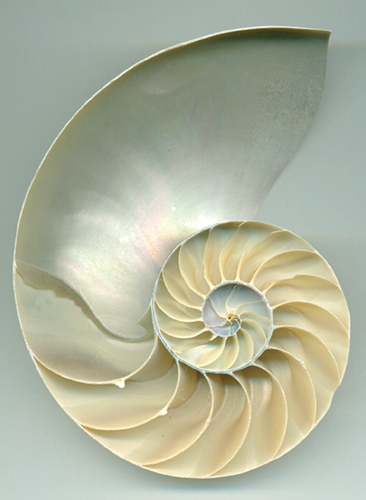
The many intriguing aspects of the logarithmic spiral all derive from this single feature. For example, a straight line from the pole O to any point on the spiral intercepts it at a constant angle α. For this reason, the curve is also known as an equiangular spiral. As a consequence, any sector with given angular width Δθ is similar to any other sector with the same angular width, regardless of how large or small it is. This property is manifested beautifully in the nautilus shell (left). The snail residing inside the shell gradually relocates from one chamber to the next, slightly larger chamber, yet all chambers are exactly similar to one another: A single blueprint serves them all.
The logarithmic spiral has been known since ancient times, but it was the Swiss mathematician Jakob Bernoulli (1654–1705) who discovered most of its properties. Bernoulli was the senior member of an eminent dynasty of mathematicians hailing from the town of Basel. He was so enamored with the logarithmic spiral that he dubbed it “spira mirabilis” and ordered it to be engraved on his tombstone after his death. His wish was fulfilled, though not quite as he had intended: For some reason, the mason engraved a linear spiral instead of a logarithmic one. (In a linear spiral the distance from the center increases arithmetically—that is, in equal amounts—as in the grooves of a vinyl record.) The linear spiral on Bernoulli’s headstone can still be seen at the cloisters of the Basel Münster, perched high on a steep hill overlooking the Rhine River.
Geometric artwork produced by Eugen Jost.
But if a wrong spiral was engraved on Bernoulli’s tombstone, at least the inscription around it holds true: Eadem mutata resurgo—“Though changed, I shall arise the same.” The verse summarizes the many features of this unique curve. Stretch it, rotate it, or invert it, it always stays the same.
Rivaling the logarithmic spiral in elegance is the cycloid, the curve traced by a point on the rim of a circle that rolls along a straight line without slipping (below). The cycloid is characterized by its arcs and cusps, with each cusp marking the instant when the point on the wheel’s rim reaches its lowest position and stays momentarily at rest.

Geometric artwork produced by Eugen Jost.
The cycloid has a rich history. In 1673, the Dutch physicist Christiaan Huygens (1629–1695) solved one of the outstanding problems that had intrigued 17th-century scientists: to find the curve down which a particle, moving only under the force of gravity, will take the same amount of time to reach a given final point, regardless of the initial position of the particle. This problem is known as the tautochrone (from the Greek words meaning “the same time”). To his surprise, Huygens found that the curve is an arc of an inverted cycloid. He tried to capitalize on his discovery by constructing a clock whose pendulum was constrained to swing between two adjacent arcs of a cycloid, so that the period of oscillations would be independent of the amplitude. (In an ordinary pendulum this condition holds only approximately.) Unfortunately, although the theory behind it was sound, the performance of Huygens’s clock fell short of his expectations.
Shortly thereafter, the cycloid made history again. In 1696 Johann Bernoulli (1667–1748), the younger brother of Jakob (of logarithmic spiral fame), posed this problem: to find the curve alongwhich a particle, again subject only to the force of gravity, will slide down in the least amount of time. You might think the answer should be the straight line connecting the initial and final positions of the particle, but this is not so: Depending on the path’s curvature, the particle may accelerate faster at one point and slower at another, showing that the path of shortest distance between two points is not necessarily the path of shortest time.
Known as the brachistochrone (“shortest time”), this problem was attempted by some of the greatest minds of the 17th century, including Galileo, who incorrectly thought the required path is an arc of a circle. In the end, five correct solutions were submitted—by Isaac Newton, Gottfried Wilhelm Leibniz, Guillaume de L’Hospital (famous for a rule in calculus named after him), and the Bernoulli brothers, who worked on the problem independently and used different methods. To their surprise, the curve turned out to be an inverted cycloid—the same curve that solved the tautochrone problem. But instead of rejoicing in their success, the two brothers became embroiled in a bitter priority dispute, resulting in a permanent rift between them.
Geometric artwork produced by Eugen Jost.
The cycloid had some more surprises in store. Evangelista Torricelli (1608–1647), inventor of the mercury barometer, is credited with finding the area under one arc of the cycloid: The area turned out to be 3πa², where a is the radius of the generating circle. A few decades later Christopher Wren (1632–1723), London’s venerable architect who rebuilt the city after the Great Fire of 1666, determined that the length of each arc is 8a; surprisingly, the constant π is not involved. This was one of the first successful rectifications of a curve—finding the arc length between two points on the curve. With the invention of calculus in the decade 1666–1676, such problems could be solved routinely, but in the early 17th century they presented a challenging task.
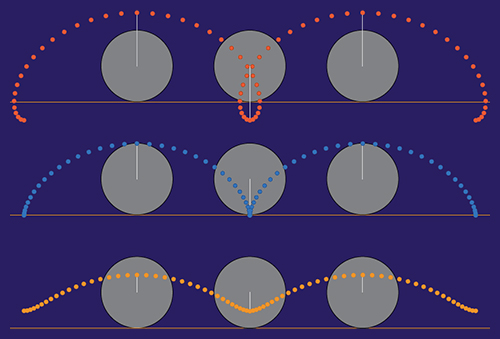
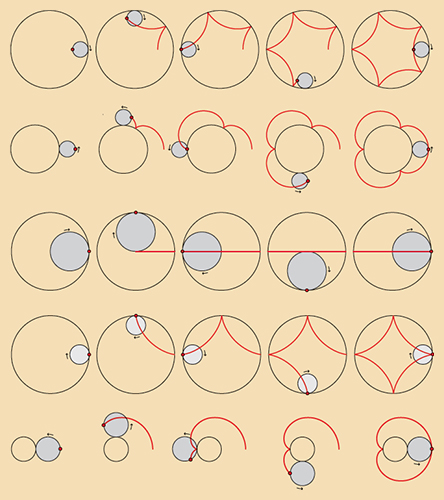
Reflections on a Rolling Wheel (above, at right), shows the path of a luminous point attached to a rolling wheel at three different distances from the center. At top, the point is outside the wheel’s rim (as on the flank of a railroad car wheel); at the middle, it is exactly on the rim; and at the bottom, inside of it. The top and bottom curves are called prolate and curtate cycloids, respectively, while the middle curve is the ordinary cycloid. You can see the curtate variant at night as the path traced by the reflector on a bicycle wheel while the cyclist moves forward.
Whereas the cycloid is generated by a point on the rim of a wheel rolling along a straight line, a related type of curve arises from a wheel rolling on the outside of a second, fixed wheel. The resulting curve is an epicycloid (from the Greek epi, meaning “over” or “above”). Alternatively, we can let the wheel roll along the inside of a fixed wheel, generating a hypocycloid (hypo = “under”). The epicycloid and hypocycloid come in a great variety of shapes, depending on the ratio of the radii of the two wheels. Let the radii of the fixed and moving wheels be R and r, respectively. If R/r is a fraction in lowest terms, say m/n, the curve will have m cusps (corners), and it will be completely traced after n full rotations around the fixed wheel. If R/r is not a fraction—if it is irrational—the curve will never close completely, although it will nearly close after many rotations.
For some special values of R/r the ensuing curves can be something of a surprise. For example, when R/r = 2, the hypocycloid becomes a straight-line segment: Each point on the rim of the rolling wheel will move back and forth along the diameter of the fixed wheel (see below, at left). Thus, two circles with radii in the ratio 2:1 can be used to draw a straight-line segment! In the 19th century this type of curve provided a potential solution to a vexing problem: how to convert the to-and-fro motion of the piston of a steam engine into a rotational motion of the wheels. It was one of many solutions proposed, but in the end it turned out to be impractical.
Geometric artwork produced by Eugen Jost.
When R/r = 4, the hypocycloid becomes the star-shaped astroid (from the Greek astron, a star). This curve has some interesting properties of its own. Its perimeter is 6R (as with the cycloid, this value is independent of π), and the area enclosed by it is 3πR2/8, that is, three-eighths the area of the fixed circle. Imagine a line segment of fixed length with its endpoints resting on the x- and y-axes, like a ladder leaning against a wall. When the ladder is allowed to assume all possible positions, it describes a region bound by one-quarter of an astroid. This shows that a curve can be formed not only by a set of points lying on it, but also by a set of lines tangent to it.
Turning now to the epicycloid, the case in which the fixed and the moving wheels have the same radius (R/r = 1) is of particular interest: It results in a cardioid, so called because of its heart-shaped form. This romantic curve has a perimeter of 16R and its area is 6πR2.
The Greek astronomer Claudius Ptolemaeus, or Ptolemy (ca. 85–165 C.E.), invoked epicyclic motion in an attempt to explain the occasional retrograde motion of the planets—a movement from east to west in the sky, instead of the usual west to east. He ascribed to them a complex path in which each planet moved along a small circle whose center moved around Earth in a much larger circle. The resulting epicycle has the shape of a coil wound around a circle. When this model still failed to account for the positions of the planets accurately, more epicycles were added on top of the existing ones, making the system increasingly cumbersome. Finally, in 1609, Johannes Kepler discovered that planets move around the Sun in ellipses, and the epicycles were laid to rest.
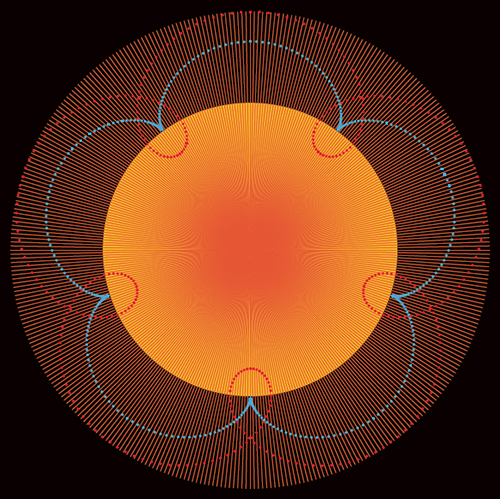
Geometric artwork produced by Eugen Jost.
The illustration above shows a five-looped epicycloid (blue) and a prolate epicycloid (red) similar to Ptolemy’s planetary epicycles. This latter curve closely resembles the apparent path of Venus against the backdrop of the fixed stars. Earth and Venus follow an eight-year cycle during which the two planets and the Sun will be aligned almost perfectly five times. Surprisingly, eight Earth years also coincide with 13 Venusian years, locking the two planets in an 8:13 celestial resonance and giving Fibonacci aficionados one more reason to celebrate!
The first half of the 19th century saw a revival of interest in classical Euclidean geometry, in which figures are constructed with straight-edge and compass and theorems are proved from a given set of axioms. This “synthetic,” or “pure,” geometry had by and large been thrown by the wayside with the invention of analytic geometry by Pierre de Fermat and René Descartes in the first half of the 17th century.
Analytic geometry is based on the idea that every geometric problem could, at least in principle, be translated into the language of algebra as a set of equations, whose solution (or solutions) could then be translated back into geometry. This unification of algebra and geometry reached its high point with the invention of the differential and integral calculus by Newton and Leibniz between 1666 and 1676; it has remained one of the chief tools of mathematicians ever since. The renewed interest in synthetic geometry came, therefore, as a fresh breath of air to a subject that had by that time been considered out of fashion.
One of the chief protagonists in this revival was the Swiss geometer Jacob Steiner (1796–1863). Steiner did not learn how to read and write until he was 14, but after studying under the famous Swiss educator Heinrich Pestalozzi, he became completely dedicated to mathematics. Among his many beautiful theorems we bring here one that became known as Steiner’s porism (more on that odd name in a moment).
Geometric artwork produced by Eugen Jost.
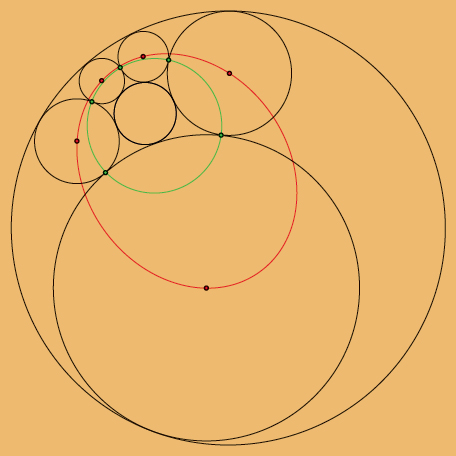
Steiner considered the following problem: Given two nonconcentric circles, one lying entirely inside the other, construct a series of secondary circles, each touching the circle preceding it in the sequence as well as the two original circles (see the figure above). Will this chain close upon itself, so that the last circle in the chain coincides with the first? Steiner, in 1826, proved that if this happens for any particular choice of the initial circle of the chain, it will happen for every choice.
In view of the seeming absence of symmetry in the configuration, this result is rather unexpected. Steiner devised a clever way of exposing hidden symmetry by inverting the two original circles into a pair of concentric circles. As a result, the chain of secondary circles (now inverted) will occupy the space between the (inverted) given circles evenly, like the metal balls between the inner and outer rings of a ball-bearing wheel. These can be moved around in a cyclic manner without affecting the chain.
But that’s not all: It turns out that the centers of the circles of the Steiner chain always lie on an ellipse (marked in red), and the points of contact of adjacent circles lie on yet another circle (marked in green).
Geometric artwork produced by Eugen Jost.
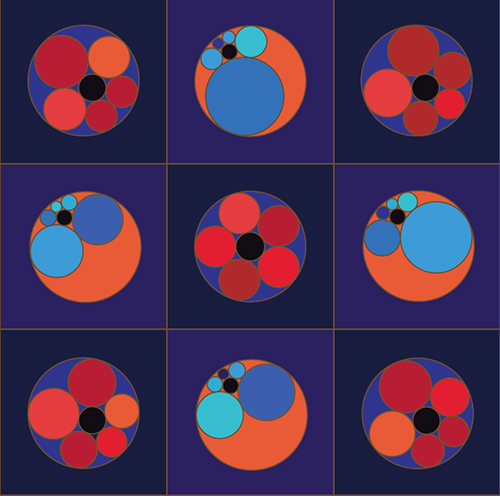
The images above illustrate nine Steiner chains, each comprising five circles that touch an outer circle (alternately colored in blue and orange) and an inner black circle. The central panel shows this chain in its inverted, symmetric “ball-bearing” configuration. As happens occasionally, a theorem that has been known in the West for many years turned out to have already been discovered earlier in the East. In this case, a Japanese mathematician, Ajima Chokuyen (1732–1798), discovered Steiner’s porism in 1784, almost half a century before Steiner. An old Japanese tradition, going back to the 17th century, was to write a geometric problem on a wooden tablet, called sangaku, and hang it in a Buddhist temple or Shinto shrine for visitors to see. A fine example of Steiner’s—or Chokuyen’s—chain appeared on a sangaku at the Ushijima Chomeiji temple in Tokyo. The tablet no longer exists, unfortunately, but an image of it appeared in a book published about the same time as Steiner’s discovery.
It is somewhat of a mystery why this theorem became known as Steiner’s porism. You will not find the word porism in your usual college dictionary, but the online Oxford English Dictionary defines it as follows: “In Euclidean geometry: a proposition arising during the investigation of some other propositions by immediate deduction from it.“ Be that as it may, the theorem again reminds us that even good old Euclidean geometry can still hold some surprises within it.
Click "American Scientist" to access home page
American Scientist Comments and Discussion
To discuss our articles or comment on them, please share them and tag American Scientist on social media platforms. Here are links to our profiles on Twitter, Facebook, and LinkedIn.
If we re-share your post, we will moderate comments/discussion following our comments policy.