The Math of Segregation
By Brian Hayes
Even in a computer model, racial divisions are not all black and white.
Even in a computer model, racial divisions are not all black and white.

DOI: 10.1511/2013.104.338
My childhood home was a stone’s throw away from a racial boundary line. I lived just outside of Philadelphia in an all-white suburb, but from my window I could look across a creek and a strip of parkland into a city neighborhood that was almost entirely black. As a boy I never thought to ask how my world came to be divided in this way, but others were puzzling over such questions. One of them was the economist Thomas C. Schelling, now of the University of Maryland.
In the 1960s Schelling devised a simple model in which a mixed group of people spontaneously segregates by race even though no one in the population desires that outcome. Initially, black and white families are randomly distributed. At each step in the modeling process the families examine their immediate neighborhood and either stay put or move elsewhere depending on whether the local racial composition suits their preferences. The procedure is repeated until everyone finds a satisfactory home (or until the simulator’s patience is exhausted).
"What prevents segregation from happening on a massive scale is that smaller-scale segregation happens first."
The outcome of the process depends on the families’ preferences. If everyone is indifferent to race, no one has reason to move. If everyone is absolutely intolerant, refusing to live near anyone of the other race, then total segregation is the only stable solution. Between these extremes lies an interesting spectrum of nonobvious behavior. Schelling discovered that segregation can emerge among residents who have only a mild preference for living with their own kind: They choose not to be in the minority within their immediate environment. These families would be happy with a 50–50 milieu, but they wind up forming enclaves where about 80 percent of their neighbors are of the same race.
Over the years the Schelling model has intrigued not just social scientists but also mathematicians, physicists, and others. Dozens of variants have been explored through computer simulations. Nevertheless, not much about the model could be established with mathematical certainty. It was not clear how the degree of segregation varies as a function of individual intolerance, nor was it certain that the system would always settle into a stable final state. Now two groups of computer scientists, returning to a version of the model very similar to the one Schelling first described, supply some provable, analytic results. Their findings include a few surprises. For example, in some cases the segregation process is self-limiting: The monochromatic enclaves stop growing at a certain size, well before they reach the scale of metropolitan apartheid I knew in Philadelphia.
My introduction to the Schelling segregation model came via programming languages designed for simulating the interactions of many independent agents. For example, the NetLogo system, created by Uri Wilensky of Northwestern University, includes a demo program based on Schelling’s ideas. On a square grid of a few thousand sites, agents of two colors are scattered at random, with a small percentage of sites left vacant. An agent is unhappy if the proportion of like-colored agents on the eight neighboring sites is less than some specified threshold τ. On each turn, every unhappy agent moves to a randomly chosen vacant site. (The move is made whether or not it improves the agent’s level of satisfaction.)
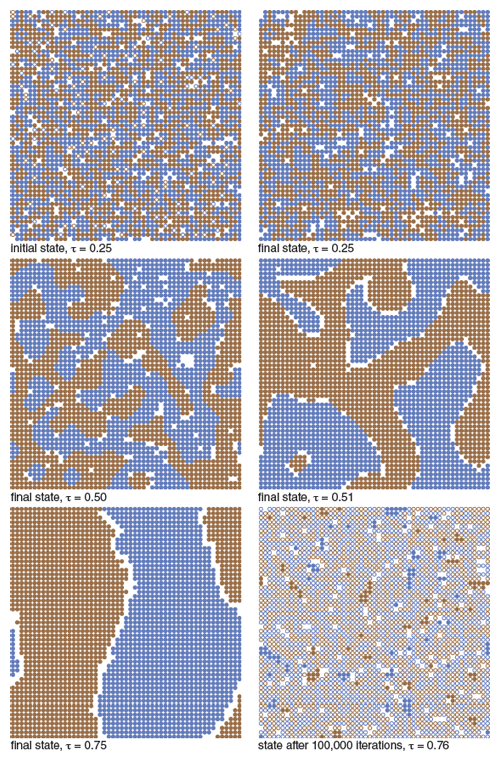
Illustration by Brian Hayes.
The illustration above shows how the NetLogo model evolves for a few values of the intolerance threshold τ. If τ is small (0.25 or less), all the agents quickly find a happy home, and the final configuration looks much like the initial random one. As τ approaches 0.5, the system tends to form mottled patterns reminiscent of camouflage, made up of oppositely colored stripes, blobs, or tentacles. As τ increases further the mottled forms grow larger, and around τ= 0.75 they coalesce into single large regions of each color, separated by an insulating barrier of vacancies. (Note that the square array in NetLogo is actually a torus, with the left edge joined to the right and the top to the bottom.)
What happens at still higher values of τ? The answer surprised me the first time I ran the simulation. There is much frantic motion, as agents of each color try to escape the other, but they make no apparent progress toward the stable, fully segregated state that would satisfy all of them. At any given moment, a snapshot of the system shows that the colors are well mixed. Thus, just as lower τ values create segregation that no one wants, the higher values lead to integration that everyone hates.
NetLogo and similar programming environments encourage an experimental approach to understanding the Schelling model. With these tools it’s easy to generate examples and gather statistics. It’s not so easy to deduce fundamental principles. For example, in all the simulations I have run, the high-τ agents never find a stationary, segregated pattern in which they can cease their turmoil, but I am wary of generalizing from this observation. If the lattice were larger—if the population of agents were allowed to grow to infinity—would the probability of segregation tend toward 0 or toward 1? I don’t know the answer for the NetLogo version of the model, but recent work has addressed questions of this kind in simpler systems.
When Schelling began his experiments in algorithmic social science, he had nothing like NetLogo to play with. Indeed, he had no computational aids at all. His first model was a paper-and-pencil affair, where agents were represented by plus signs and zeros. Furthermore, the model was one-dimensional, with the symbols arranged along a line rather than on a plane. And the rules of the game were stricter: Agents could move only if doing so transformed them from unhappy to happy; neither neutral nor unfavorable moves were allowed.
A paper presented last year at the Symposium on the Theory of Computing harks back to the original one-dimensional Schelling model. The authors are Christina Brandt of Stanford University, Nicole Immorlica of the Microsoft New England Research Center, Gautam Kamath of MIT, and Robert Kleinberg of Cornell University. For convenience I refer to this quartet as the BIKK group.
The BIKK model does not match Schelling’s first version in every detail, but it’s close. N agents are randomly assigned to two color groups and randomly arranged along a line. The ends of the line are then joined to form a ring. There are no vacant sites. Every agent surveys a neighborhood that includes its own site and w sites to the left and right, for a total of 2 w +1 neighbors. The agent is unhappy if the proportion of like-colored agents in this interval is less than the threshold τ; in the BIKK study τ is always equal to 1/2. A move consists in swapping two randomly chosen unhappy agents of opposite colors. (With τ=1/2, the swap necessarily makes both agents happy.)
The BIKK group proves that this system evolves to a “frozen” state, in which no more swaps are possible. The frozen state is segregated, in the sense that most agents find themselves in an environment where well over 50 percent of their neighbors are like-colored. But the segregation is local rather than global. The society breaks down into blocks whose size is determined by the neighborhood radius w , not by the overall population size N . Specifically, as w increases, the block size grows no faster than w 2 . (The BIKK group hopes to improve on this result, showing that the growth rate is no greater than w .)
Because of the randomness inherent in the Schelling process, the proofs have a probabilistic aspect. It’s not possible to say that the model will absolutely never yield two giant monochromatic blocks; after all, the random initialization of the sites could produce that state at the outset. But the proof shows that as N goes to infinity, the probability of such an anomalous event approaches zero.
The key idea behind the BIKK analysis is the observation that once a monochromatic run of sites reaches a length of w +1, none of those agents will ever again become unhappy, and so they will never move. Such a formation is called a firewall, because agents of the opposite color cannot go through it. The BIKK authors establish upper and lower bounds on the frequency of firewalls, showing that “for any site on the ring, with high probability, the process will eventually form firewalls of both colors on both sides of the site.” The firewalls become the nuclei of the segregated blocks. Because there are a fair number of firewalls, they cannot grow too big before they run into each other.
The BIKK analysis applies only to the case τ=1/2. Recently a second group has filled in details for other values of τ. The authors are George Barmpalias of the Chinese Academy of Sciences and Richard Elwes and Andy Lewis-Pye of the University of Leeds in England (the BEL group). They construct a phase diagram for the one-dimensional Schelling model. The system passes through four main behavioral regimes as τ goes from 0 to 1.
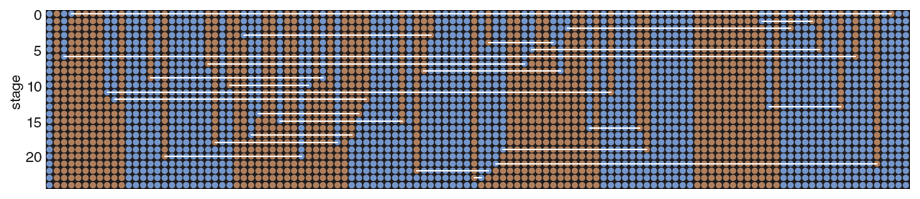
Illustration by Brian Hayes.
As in the NetLogo model, the smallest values of τ define a region where not much happens. Most agents are “born happy”; they never have cause to leave their initial position, and so the racial structure is little changed from the random distribution. The BEL group shows that this phase of near-indifference to race extends from τ=0 up to a certain constant κ, which has a numerical value of about 0.353. (The derivation of κ is a fascinating bit of number theory and analysis, but too long a detour to present here.)
At values of τ above κ but below 1/2, a new, segregated phase abruptly takes over. Indeed, in this region—where agents tolerate being in a local minority—the system is more segregated than it is at τ=1/2, the threshold where minority status becomes unacceptable. (In this context, “more segregated” means the typical length of a monochromatic block is greater.)
Kleinberg suggests a way of understanding this counterintuitive finding. At τ=1/2, he says, “what prevents segregation from happening on a massive scale is that smaller-scale segregation happens first, and it imposes a stable structure that limits the further spread of monochromatic runs.” In the τ<1/2 region, by contrast, fewer firewall structures provide nuclei for monochromatic runs, with the result that those runs can grow to greater length.
Continuing through the phase diagram, at τ=1/2 we enter the territory already explored by the BIKK group. Then, for even higher τ values, where agents demand not just equality of numbers but an absolute majority, the final phase appears. Here the outcome is total apartheid, as the agents of each color withdraw into a single mass occupying half the ring. Once this configuration is reached, the separation is irreversible.
Many more variations of the Schelling model remain to be investigated. One might ask how the outcome changes when the two subpopulations differ in size. Or one might allow preferences to vary between groups or between individuals with a group. And the biggest question is whether any of the results for linear models can be made to work on the plane. That task will be challenging: In one dimension, the boundary between two regions is always a single point, but borderlines on the plane can have convoluted shapes that affect neighborhood composition.
Can a game played with colored dots tell us anything useful about housing patterns and race relations in real cities? Racial segregation is not purely a result of individuals expressing preferences about their neighbors. There are legal, economic, and institutional forces at work as well. And segregation is generally not a symmetric process, in which two groups agree to live apart, but rather is a mechanism by which one group excludes the other. All of this is left out of the Schelling model.
But the absurd simplicity of the model is also its main fascination. Even mindless colored dots, entirely innocent of history and geography, can give rise to complex patterns no one expected or wanted. The dynamic at the heart of the model is more mathematical than sociological. It’s just this: If I move from Downtown to Uptown because I seek different neighbors, my presence in one place and my absence from the other alters both of those environments, which may induce others to move in turn. What could be more obvious? Yet the consequences are not easily foreseen.
My own qualms about the model focus not on oversimplification but on questions of robustness—of sensitivity to details of implementation. For example, in Schelling’s first version of the model, an unhappy agent moved to the nearest open location, not to a randomly chosen one; this deterministic choice seems to yield dramatically different results in some cases. Small changes in the rules governing favorable, neutral, and unfavorable moves also have major effects. Such sensitivity to minor variations is worrisome in a model meant to represent human behavior.
Markus M. Möbius of Microsoft Research and Tanya S. Rosenblat of Iowa State University have tried to test the model against real-world data. Working with census records for Chicago, they find evidence supporting the hypothesis that local interactions have the strongest influence on racial preferences, as in the Schelling model; the effective radius when people choose a neighborhood may be as small as 150 meters.
Meanwhile, back in my old neighborhood on the western edge of Philadelphia, the social fabric of segregation has begun to fray. According to the 2010 Census, the block group that includes my former home is now two-thirds African-American; on the other hand, the city neighborhood across the creek is still only 1 percent white.
Regrettably, the Schelling model can have nothing to say about this further evolution of the urban scene. The model describes only the genesis of segregation; once the colored dots have all sorted themselves into monochrome units, the map can never change. I would love to believe that the time has come for a model of racial reintegration.
©Brian Hayes
Click "American Scientist" to access home page
American Scientist Comments and Discussion
To discuss our articles or comment on them, please share them and tag American Scientist on social media platforms. Here are links to our profiles on Twitter, Facebook, and LinkedIn.
If we re-share your post, we will moderate comments/discussion following our comments policy.