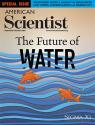
A Delta in Peril
By Meraz Mostafa, Naznin Nasir, M. Feisal Rahman, Saleemul Huq
Rising Salinity in Coastal Bangladesh
Rising Salinity in Coastal Bangladesh
Almost 30 years ago, early in the morning before the Sun was out, community activist Korounamoyee Sardar was brutally murdered by a gang of hired goons, locally known as mastan. Her body was cut into several pieces and scattered throughout the river, between the nearby man-made islands, called polders. If not for her fellow activists, we’d probably never have known what happened to her.
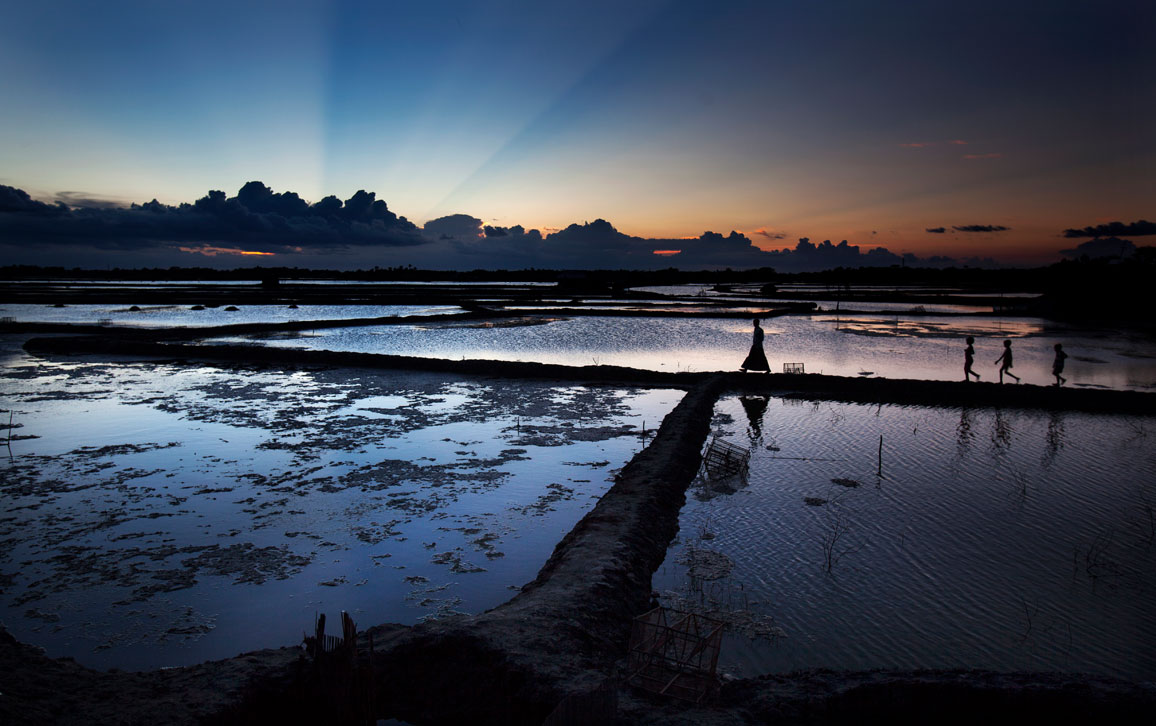
Marcin Szczepanski
Click "American Scientist" to access home page
American Scientist Comments and Discussion
To discuss our articles or comment on them, please share them and tag American Scientist on social media platforms. Here are links to our profiles on Twitter, Facebook, and LinkedIn.
If we re-share your post, we will moderate comments/discussion following our comments policy.