This Article From Issue
January-February 2010
Volume 98, Number 1
Page 83
DOI: 10.1511/2010.82.83
NAMING NATURE: The Clash Between Instinct and Science. Carol Kaesuk Yoon. viii + 344 pp. W. W. Norton and Company, 2009. $27.95.
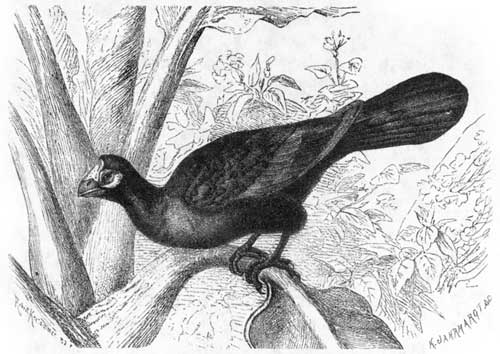
From Naming Nature.
Ad Right
Our ambivalent responses to the rise of modern science and technology are among the most fascinating things to study in the history of science. From Margaret Cavendish’s criticism of the experimental method in the 17th century to the rebellion of the so-called Romantics against the notion of objectivity, our culture has had a complex love-hate relationship with science. Champions of feeling, emotion and subjective knowledge as a path toward understanding the natural world have proved especially persistent critics of science.
Naming Nature, by Carol Kaesuk Yoon, is a thought-provoking text that plays a new and fascinating tune on the old theme of objectivity versus subjectivity. Its subject is the history of biological systematics—the description, ordering and explanation of biological diversity.
In Yoon’s rendition, subjectivity is rooted firmly in our instinct. She explains that neuroscience, anthropology and evolutionary biology now tell us that we are born with the remnants of an instinctive perspective on the living world, which she calls the “human umwelt,” a vision “molded during our species’ days as hunter-gatherers.” This vision of a natural order is “thoroughly sensuous and wildly subjective,” Yoon says, and she maintains that the history of scientific taxonomy is really a “two-hundred-year-long battle against the human umwelt.” In modern times, we have given up this instinctive perception of the order of nature in favor of letting scientists find a more objective, evolutionary order, with the result that we are now disconnected from nature: “We are so used to someone else being in charge of the living world that we have begun not to even see the life around us.” Yoon argues that in order to reconnect to nature (and save the planet) we must begin to “kindly” thumb our noses at science.
Yoon notes that she had not planned to write a book like this. She began the project as a history of the science of classification that would show the triumphant march of scientific progress as taxonomists improved on the crazy orderings of the past. But as she researched the topic, her attempt to describe science’s constant march toward increasingly true accounts of the natural order morphed—to her surprise—into a critique.
I began to see that science was neither the best nor the only valid way to order and name the living world. Instead, I realized that the ordering and naming of life was and always had been, at its heart, something much more democratic, subversive to the dominion of science even, and much more interesting. I eventually came to see that science itself might be undermining the very thing it sought to perfect: humanity’s understanding of life.
Before you dismiss (or praise) Yoon as a relativist and postmodernist, out to bring down science’s hegemony, consider her background. She holds a B.S. in biology from Yale and a Ph.D. in ecology and evolutionary biology from Cornell. “This was not,” she writes forcefully, “where I expected or ever wanted to land.”
As she makes her argument about the role and importance of the human umwelt, Yoon traverses a wide territory. Anthropology makes an appearance in her discussions of studies of how non-Western cultures classify animals and plants (much as the West does, it turns out). Neuroscience provides evidence of the umwelt through studies of individuals who, as a result of damage to specific areas in the temporal lobe of the brain, have completely lost their ability to recognize and name living things. The history of systematics is chronicled in chapters on the heroes of classification, Carolus Linnaeus and Charles Darwin. Then, after devoting just three and a half pages to the period from 1859 to 1950, Yoon provides an entertaining account of 20th-century systematics and the rise of cladistics, which dealt the umwelt a death blow.
Yoon’s unapologetic fascination with and belief in the human umwelt colors her interpretations of all of these stories. As a result, she inevitably runs into the problems typical of efforts to apply an overarching theory to a range of material. Systematists’ complex challenges in ordering life, including the endless debates over what a species is, are all attributed to their struggles with the umwelt. And, when things get nasty (as they certainly did in late-20th-century systematics), Yoon maintains that the vitriol and name-calling are all attributable to the fact that nothing less than the human umwelt is at stake. Moreover, she believes that the success of creationists—from “Soapy Sam” Wilberforce to modern-day proponents of “intelligent design”—in battling evolution is chiefly due to the power of the human umwelt. And why have people resisted the idea that race is not biologically real? “The answer, yet again, is the umwelt.”
Yoon’s reduction of complex historical problems to the umwelt reaches particularly frustrating proportions in her claim that there is a tight, causal link between our having turned over the task of naming to scientists and our having become disconnected from nature. That disconnect, she says, accounts for the fact that species after species has disappeared “with hardly anyone noticing or much caring.”
As one might expect given her thesis, Yoon finds the “key to remedying all of this” in reclaiming the “apparently incorrect names and categorizations” created by nonscientists around the world and throughout history. “The living world is dying,” she writes, “but it’s not too late.” Her apocalyptic rhetoric not withstanding, Yoon does not convincingly establish that the rise of scientific taxonomy played any role in making people indifferent toward the extinction of species.
Despite these problems, anyone teaching an undergraduate course on the history of science and looking for a way to make the history of systematics exciting will find the book very useful. Conversational, personal and provocative, it is precisely what’s needed. Students who are wrestling with the complex interplay between values and science will find it engaging. I suspect that most students will either love or hate the book’s argument, style, assumptions and conclusions. But that Yoon began as a committed fan of science should inspire some fascinating conversations as students themselves begin to acquire a more complex and nuanced understanding of science in modern society.
Furthermore, Yoon’s book can be placed within a long tradition of questioning the assumptions and privileges of science (although nowhere does she acknowledge this tradition). Students could read Cavendish, Rousseau, Goethe and others, comparing these historical figures’ responses to the rise of science with Yoon’s story. Some questions for them—and us—to consider: When Yoon asks us to reclaim our umwelt by finding an organism and getting “a sense of it, its shape, color, size, feel, smell, sound,” is she asking us to do anything different than Thoreau did more than 150 years ago? Are her motivations so very different from his? Did Thoreau’s ambivalence toward science—a feeling that allowed him similarly to question science’s authority even as he tried to obey its rules—arise from a different source than Yoon’s? And then students could discuss whether, just as each age needs its own version of Galileo and Darwin, each age may need its own framework for pitting what is in one’s own mind (whether one attributes that to instinct or to innate ideas) against what the experts say is true.
Kristin Johnson is an assistant professor in the Science, Technology and Society Program at the University of Puget Sound in Tacoma, Washington.

American Scientist Comments and Discussion
To discuss our articles or comment on them, please share them and tag American Scientist on social media platforms. Here are links to our profiles on Twitter, Facebook, and LinkedIn.
If we re-share your post, we will moderate comments/discussion following our comments policy.