This Article From Issue
May-June 2023
Volume 111, Number 3
Page 130
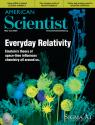
Seeing the northern lights is breathtaking, and those viewing them may wonder how they come about, but it’s fairly safe to say that few observers are thinking about relativity when considering the origins of these auroras. Indeed, relativistic effects aren’t just confined to physics, and as Abhik Ghosh and Kenneth Ruud explain in “Relativity and the World of Molecules,” relativity is involved not only in auroras but also in phosphorescence, the color of gold, the state of mercury, and many other chemical phenomena. Auroras are one way that relativity makes the world more beautiful, say Ghosh and Ruud, and as professors at the world’s northernmost university, UiT–The Arctic University of Norway in Tromsø, they are able to observe these lights, and draw inspiration from them, frequently.
A different natural phenomenon offering beauty and serenity is the focus of another feature in this issue, “The Mathematics of Beach Pebbles,” by Theodore P. Hill and Kent E. Morrison. They evaluate the challenges with modeling how stones tossed about in waves tend to become oval in shape rather than spherical. The history of this inquiry is a fascinating lesson about ensuring that a model includes all relevant data, but the work also has important implications for understanding Martian geology, erosion, and the strength of materials such as concrete.
Treatment of the world around us is a central point in “Pyrocene Park” by Stephen J. Pyne. Past fire prevention policies, says Pyne, have paradoxically endangered the environment in Yosemite National Park, allowing it to become overgrown. Although prescribed burns were returned to the park in the 1970s, balancing the practice with more frequent, dangerous wildfires has proved to be complicated. But the situation as it stands threatens a grove of ancient sequoias that require protection.
In Perspective, the environment itself is shown to be a source of genetic data about its inhabitants. Asia Murphy, in “Wildlife Surveys Out of Thin Air,” talks about new methods of obtaining DNA from the environment: Advances in sampling and analysis now allow for extraction of an organism’s genetic material from the air, the water, blood samples from parasites, and other substrates. These techniques can help characterize what organisms have been in an existing ecosystem. Researchers are also developing ways to quickly capture and analyze RNA in the environment.
In this issue’s Policy column, Christian H. Ross and Samantha Jo Fried look at the environment from multiple perspectives. In “Why STEM Education—and Democracy—Need Civic Science,” the authors argue that STEM students need training on how to engage with diverse communities while putting science in a context that will help to solve societal problems. Some of these civic science training programs involve such forms of environmental service as removing introduced plant species or testing water for microplastics.
This issue’s Engineering column also considers location. In “Museums of Bridges," Henry Petroski looks at structures in rural areas and discusses the different ways that engineers and architects consider how to blend their creations with a natural setting to enhance the experiences of visitors.
How do you draw inspiration from the world around you, either from the natural environment or the setting in which you find yourself? Consider yourself invited to let us know by either sending us a message through our website or joining us on social media to share your thoughts.
—Fenella Saunders (@FenellaSaunders)

American Scientist Comments and Discussion
To discuss our articles or comment on them, please share them and tag American Scientist on social media platforms. Here are links to our profiles on Twitter, Facebook, and LinkedIn.
If we re-share your post, we will moderate comments/discussion following our comments policy.