This Article From Issue
November-December 1999
Volume 87, Number 6
DOI: 10.1511/1999.42.0
ENIAC: The Triumph and Tragedies of the World's First Computer. Scott McCartney. 272 pp. Walker and Company, 1999. $23.
Howard Aiken: Portrait of a Computer Pioneer. I. Bernard Cohen. 412 pp. The MIT Press, 1999. $34.95.
Scott McCartney has created a fascinating personalized history of John Mauchly and J. A. Presper Eckert's development of the eniac, the first digital, general-purpose electronic computer. By concentrating on the human side of the development and its consequences rather than on technical aspects, this book follows very much in the tradition of other recent popular histories of corporate success and failure in the computer field. It is based on documents from the archives of several institutions, interviews with surviving participants, personal papers of both Mauchly and Eckert and other previously unexamined sources.
Ad Right
Mauchly and Eckert met at a War Department-sponsored electronics course at the University of Pennsylvania in 1941. Casual conversations between them during that course led them to conclude that a fully electronic calculator was a feasible project and should be attempted. Aware by chance of their ideas, a young Army mathematician, Herman Goldstein, was instrumental in procuring funding for Penn for what came to be known as the eniac project, for Electronic Numerical Integrator And Computer. Despite the title, McCartney devotes only about one-third of the book to the three-year development of the eniac and more than half to the repercussions of this achievement over the next three decades—personal, business, legal and historical. McCartney clearly projects what might have been: Philadelphia, not Silicon Valley, as the computer center of the world; RCA or EMCC, not IBM, DEC and Apple, as major computer companies; and Eckert and Mauchly as multimillionaires like Gates, Jobs and Cray.
Despite their 12-year difference in age, Mauchly and Eckert formed a well-balanced team with abundant energy, an enthusiasm for creating working electrical devices and a broad and accurate vision of the computer's potential. Their failure to reap financial rewards and historical credit for their technical success is shown to arise from their poor marketing and business skills, from their penchant for building devices rather than writing about their work and from the abilities of adversarial lawyers. The tragedies cited in the subtitle of the book include suicides, a drowning of a wife, financial losses, invalidation of the eniac patent and numerous misappropriations of credit; whereas the triumph refers not only to the technical success of the eniac itself but also to the subsequent success of the whole computer industry and the enormous impact these machines have had on the lives of all of us today.
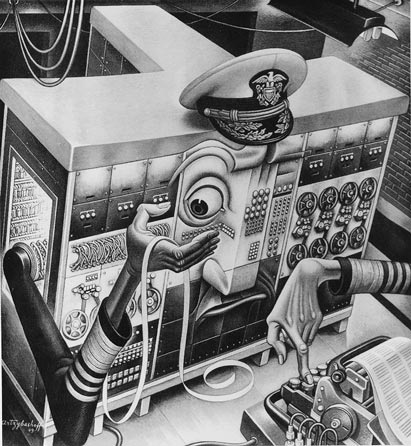
From Howard Aiken: Portrait of a Computer Pioneer.
Howard Aiken: Portrait of a Computer Pioneer is an appropriate companion to eniac. Aiken (1900– 1973) was an imposing figure, both in physical presence and in personality. He has been characterized as a maverick, hard-driving, assertive, commanding, blunt, considerate, innovative, influential, sensitive, kind, thoughtful, generous, acerbic, humorous, honest, stubborn, bitter, colorful and stormy. He was all these and more. Raised in a poverty-stricken, one-parent family, Aiken put himself through college but was unable to enter graduate school until age 32. Nonetheless, his abilities were quickly recognized. In 1941, only two years following his physics Ph.D. from Harvard University, he was appointed a tenured, associate professorship there, and five years later became full professor. He was one of the first to introduce graduate courses and degree programs in computer science and attracted a succession of brilliant students who also became leaders in the new field. Aiken conceived the possibility of a calculating machine while working on his master's degree and conceptualized its architecture and general mode of operation. The Mark I, or Automatic Sequence Controlled Calculator (ASCC), was realized in 1943, more than five years after Aiken approached IBM seeking capital and engineering support for his conception. Controversy continues to this day over who contributed what and who should get the credit, but clearly neither IBM nor Aiken could have succeeded without the other. Aiken also had strong interests in the history of science, in business as well as scientific applications of computers and in teaching and mentoring students and younger co-workers.
I. Bernard Cohen, Harvard emeritus professor of the history of science, is eminently qualified to produce this book. He was Aiken's colleague, is co-editor of a multivolume series on the history of computing and is well connected in the history of science and technology. The sources used for the book included a two-day interview with Aiken himself; discussions with former students, friends, professional colleagues and his third wife, Mary Aiken; the archives of Harvard and IBM; L. Saphire's interviews in IBM's oral history project; and reviews of Aiken's contributions in the 1983 Pioneer Day at the National Computer Conference.
This biography is instructive, entertaining and stimulating in many ways. This reviewer regrets, therefore, the need to record some disappointments. The book concentrates on Aiken's professional life and says nothing about his private life—hobbies, recreations and family. And the editing and compilation of the book also leave much to be desired. For example, more than three dozen errors remain in the final edition.—Jack H. Westbrook, Brookline Technologies, Ballston Spa, New York
American Scientist Comments and Discussion
To discuss our articles or comment on them, please share them and tag American Scientist on social media platforms. Here are links to our profiles on Twitter, Facebook, and LinkedIn.
If we re-share your post, we will moderate comments/discussion following our comments policy.