Gene Chips and Functional Genomics
By Hisham Hamadeh, Cynthia Afshari
A new technology will allow environmental health scientists to track the expression of thousands of genes in a single, fast and easy test
A new technology will allow environmental health scientists to track the expression of thousands of genes in a single, fast and easy test

DOI: 10.1511/2000.41.508
Just as physics and the space program dominated the century that is now ending, biotechnology will dominate the coming one. As if to underscore this point, the Human Genome Project and Celera Genomics jointly announced earlier this year that they had succeeded in sequencing most of the human genome. This and other biotechnological advances grab our attention because they offer at least the promise of improving our lives and health through the development of better drugs, more efficient diagnostics, healthier foods and a cleaner environment.
In this new era, novel technologies are supplementing traditional biological methods. Computing tools coupled with sophisticated engineering devices now facilitate discovery in specialized areas such as genetics. The rapid sequencing of the entire genome of people, as well as that of other organisms, provides a wealth of information about who we are genetically. However, whereas our complete genetic code will soon be known, we will not understand the meaning—the translation—of the code for quite some time. Among the emerging new technologies are those that take us to that next step in discerning gene function.

Wesley Docxe/Photo Researchers, Inc.
One such advance merges inventions from the semiconductor and computer industry with laser engineering and with high-level mathematical computations. This technological amalgam underlies the DNA microarray or, as it is better known, gene-chip technology. Microarrays will allow scientists and physicians to assess the genetic status of an entire organ, or maybe someday, an entire organism, even if they do not know the exact function of every gene. In our laboratory, we are especially interested in understanding how environmental toxicants may affect gene expression, and we are applying gene-chip technology toward this end.
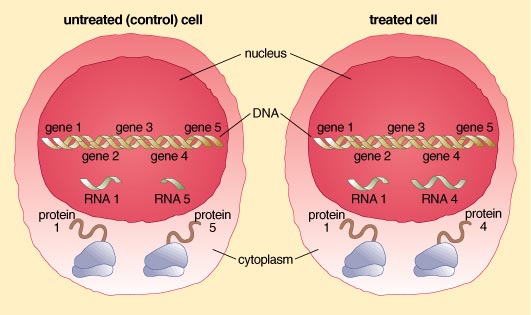
The most basic living unit of an organism is the cell. Organs comprise a collection of multiple cell types that work in concert to provide structure and function to the organ system. Within the center of each cell lies the nucleus. And within the nucleus can be found the genetic material—DNA—that contains the code for producing almost all of the cellular machinery. DNA, or deoxyribonucleic acid, serves as a template for the enzymes and proteins that give each cell type its unique functional and morphological characteristics. Each DNA molecule is a string of smaller subunits called nucleotides, and encrypted in the sequence of DNA's nucleotides is the order in which different amino acids should be strung together to make proteins. Proteins are often referred to as "the workhorses of the cell," as they provide the cell with much of its structure and carry out almost all of its functions.
Within each cell of each individual the DNA code is identical. Yet the individual contains any number of specialized cells, such as those that make up muscle, skin, nerve and the immune system. This fact forces us to ask how specialized cell types become differentiated. How, for example, does an immune cell "know" to produce antibodies in response to bacteria? Why does a neuron manufacture the structures and chemicals to conduct nerve impulses but not to produce antibodies?
The answer is that only a subset of the DNA code is "expressed" in each cell type. The expressed genes of the immune cell, for example, include those encoding the manufacture of antibodies, whereas the antibody genes remain unexpressed in neurons. This differential expression of the DNA code is what makes each cell unique and provides the basis for cellular function and processes.
The first phase of the genomic era has focused on elucidating the exact sequence of the nucleotides in the DNA code. With that part of the work nearly completed, investigators now want to know how the DNA code translates into gene function. They want to learn which genes are responsible for important healthy functions and which, when they become damaged, contribute to disease. They also want to understand how and when signals external to the cell stimulate gene expression within it. Investigators would like to understand, for example, how the immune cell translates the presence of bacteria into gene expression of an antibody gene. Accordingly, the new field of "functional genomics" focuses on the expression of the DNA.
Barbara Aulicino
DNA expression proceeds in several steps. First, specific DNA segments corresponding to individual genes are copied from DNA into RNA molecules, which are chemically very similar to DNA. In this step, RNA molecules are said to be "transcribed" from DNA, an operation that takes place in the cell's nucleus. As the archive for a cell's genetic instructions, nuclear DNA is too precious to be shuffled around the cell. Instead, the shorter-lived RNA copy moves from the nucleus to the cytoplasm where its code—its nucleotide sequence—is "translated," such that amino acids are strung together to form proteins.
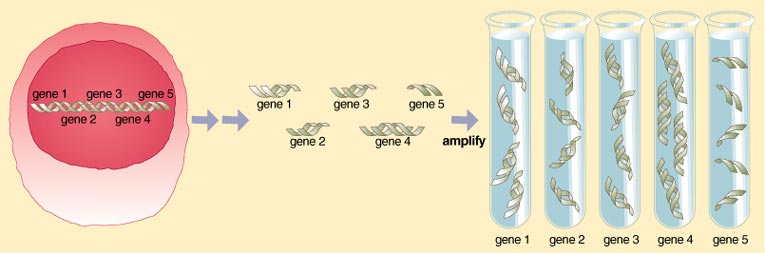
One way, then, to determine which genes are being expressed at any given time is to cull all of the RNA molecules transcribed in a cell at that moment. In this way, a scientist can determine which gene or genes are active during an important cellular activity—cell division, for example. Those RNAs are likely coding for proteins whose specific function is to contribute to cell division, particularly if they are not transcribed when the cell is at rest. To make that determination, scientists would want to compare the cluster of RNAs produced in a dividing cell with those produced by a resting cell. Microarrays allow for many such comparisons. In our lab, for example, we are primarily interested in comparing RNA molecules transcribed under normal conditions with those transcribed when the cell is exposed to a toxic environmental chemical. Microarrays allow us to assess very quickly all of the RNA molecules being transcribed in a cell at a given time under particular circumstances. We can do this, even if we do not know the exact function for each gene. Yet knowing when that gene is expressed may ultimately help us learn the gene's function as well.
Until recently, assessing RNA in cells was painstaking and time-consuming. In 1995, researchers including Patrick Brown and colleagues at Stanford University developed a new technology adapted from the microchips used by the computer industry. The resulting DNA microarrays—the so-called gene chips—are indeed potent investigative tools, where the status of thousands of genes from any biological origin can be monitored simultaneously for changes in levels of gene expression. The difference between the old and new methods is striking. Traditional assays measure RNA transcripts from one gene at a time over a three-day period. Gene chips can measure transcripts from thousands of genes in a single afternoon.
Barbara Aulicino
The theory behind the gene chip is fairly simple and exploits a basic fact of the chemistry of DNA and RNA. An RNA molecule can bind with its DNA template, but not with DNA templates whose sequences are very different from its own. A gene chip holds copies of most of the DNA templates contained within a particular cell. The subset of genes being expressed by that cell type at any given time is expressed as a group of RNA molecules, which serve as messages to the protein-manufacturing machinery. In the laboratory, those RNA messages are transcribed once more to form complementary DNA (cDNA) message molecules. A cDNA can also bind with its complementary DNA template. When the cDNAs are exposed to the DNA chip, the message molecules recognize and adhere to the spots on the chip corresponding to their DNA templates. These message molecules have been tagged with fluorescent dyes, so when scientists look at this chip, they can see the pattern of genes being expressed at any particular time. They can also compare a spot and note that a gene is not being expressed under one circumstance, but it is under another. That is, no message is being manufactured under, say, the normal situation, but it is manufactured when the cell is exposed to a toxic chemical.
A DNA chip is made using a glass microscope slide, 7.62 centimeters by 2.54 centimeters and about 1.2 millimeters thick. Samples of DNA, in the form of spots, are "printed" on the slide, using a procedure similar to the one used to print computer chips. The DNA spots adhere to the slide, each spot being a cloned DNA sequence that represents a gene. The DNA molecules that make up the spots include either fully sequenced genes of known function, or collections of partially sequenced, unknown genes.
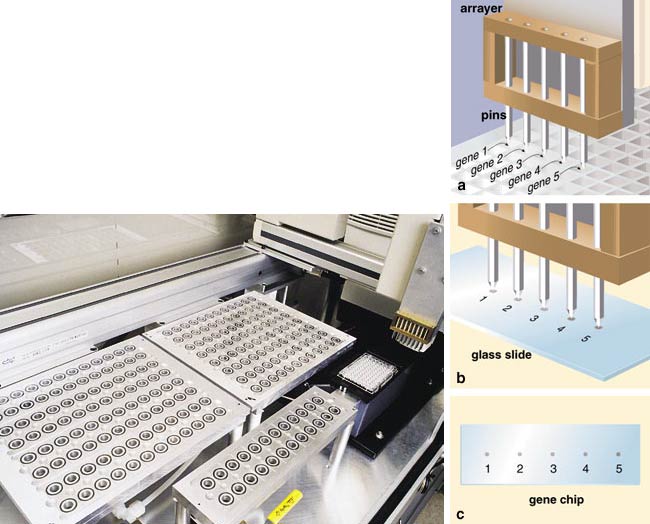
Chip manufacturing—printing or spotting—is done with a machine called an arrayer. Most arrayers are still custom-built instruments featuring a high-speed robotic arm fitted with a number of pins. The arm is controlled by software that allows the user to place genes in select areas and configurations on the glass slide to generate a cDNA microarray chip. The pins resemble the tips of quill pens. By capillary action, each pin draws up a small amount of a solution containing the DNA for a single gene and deposits it in a precise location on a glass slide. Since the arm holds many such pins, many genes are deposited on the slide at a time. Computers keep track of the location of each gene on the gene chip.
The arrayer is housed in a clean chamber where temperature and humidity are monitored and maintained constant so as to produce consistent and evenly sized spots. In some configurations it is possible to print up to 50,000 genes on one chip, and efforts are underway to increase that number as demand grows. The spotted genes/DNA are linked to the surface of the glass slide by either covalent bonds or charge interactions.
Once the gene chip is prepared and is spotted with the entire set of cDNAs from the cell or tissue of interest, investigators can use it to look at gene expression in various cells and organs under different circumstances. This again is done by withdrawing message molecules from the sample cells or organs to see exactly which subset of genes is being expressed at any given moment. In this way, patterns of gene expression may be compared from a normal versus diseased tissue, an untreated versus drug or chemically treated cell, or a normal versus a mutant cell.
Messages in the form of RNA may be derived from any species, including bacteria, fungi, plants or animals. Most RNA molecules code for protein and are shuttled from the cell nucleus to the cytoplasm and there are translated into protein. These so-called messenger RNA molecules (mRNA) can contain between 400 to 10,000 nucleotides, the sequence of which serves to indicate the corresponding amino acid sequence of a protein.
Barbara Aulicino
The number of copies of the RNA "message" transcribed from a gene often relates directly to the quantity of protein ultimately produced. For example, if a large amount of protein will be required, a large number of RNA transcripts for that protein will probably be present in the cell's cytoplasm. A small amount of RNA in the cytoplasm may indicate that a small amount of protein is to be made. Therefore, by measuring the amount of message in the cell, scientists can not only determine which genes are being expressed, they can also determine at what levels they are being expressed. This is especially useful for comparisons between samples. Often scientists want to know whether certain conditions alter the level of gene expression—that is, whether a particular gene is expressed in greater or lesser quantities in response to some environmental exposure.
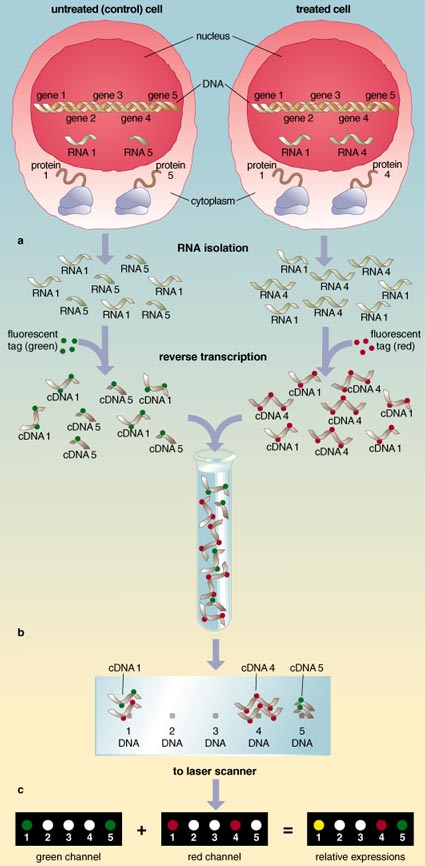
Differential expression measurements are carried out using a simultaneous, two-color fluorescence hybridization scheme. cDNAs are converted from RNA molecules in the presence of nucleotides to which a fluorescent colored dye has been attached. Different colors can be given to the message derived from different cells, such that the message from the control cells can be tagged green, for example, whereas the message from chemically treated cells might be tagged red.
Barbara Aulicino
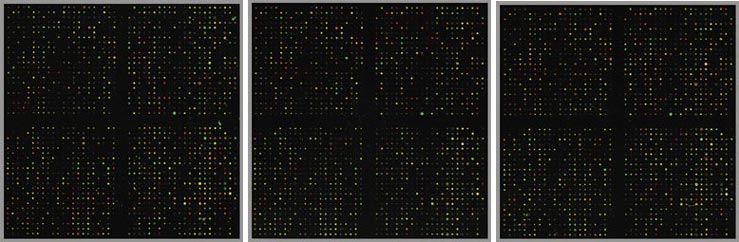
Image courtesy of Hamadeh and Afshari
The color-coding allows for a very clear way of comparing the quantities of message from each cell. The fluorescently labeled messages derived from different groups of cells are mixed and bound simultaneously on the same cDNA microarray chip. The array is then optically scanned at two wavelengths using independent lasers to excite the two fluorescent dyes at 632 and 532 nanometers for the red and green labels, respectively. Information from the scanner is translated into images corresponding to the two dyes scanned, and this is sent to a computer for further analysis. The computer produces two different pictures of the gene chip. One shows the location of all the spots lit in green and notes the intensity of the green spots. The other picture notes the location and intensity of all of the red spots.
These two images are then overlaid using specialized software that assigns a color for each tag and compares the two images. The result is a very colorful display of spots ranging between green and red. From this, scientists can determine the relative abundance of message manufactured in each cell.
For example, if a gene is expressed in equal amounts in both the control and the treated samples, then the computer will note equal amounts of red dye and green dye. The computer will indicate such a spot as yellow. Should a gene be highly expressed in the control cell, the one where the messages are colored green, but less so in the treated cell, then the spot will show up as predominantly green. If the gene is expressed in the treated cell but less so in the control, the spot will show up as predominantly red.
Image-analysis software generates a report that contains numerical data, which are more informative than the colorful spotted figure. The results are generated in a variety of formats depending on the software used. The report contains ratios calculated for each gene. These are derived from the intensity values of the two color scans. A gene expressed in equal intensities in the two samples would exhibit a ratio close to one. Using a statistical formula, the software determines the set of genes whose expression is significantly altered in the treated cells. This method is highly sensitive. It is possible to detect changes in the expression level of a gene of about 1.5 times using this technology.
The amount of data that results from these experiments can often be overwhelming. A single gene chip may generate over 10,000 data points. The volume of data grows exponentially when one uses multiple sets of chips, as is the case when replicate experiments are performed. In addition, for some biological studies it may be necessary to examine changes in gene expression over multiple time points or with varying dose levels.
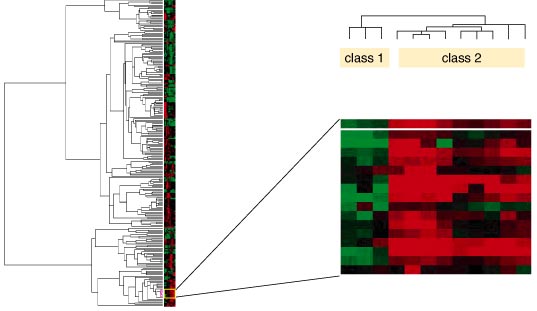
Image courtesy of Hamadeh and Afshari
The reams of data pose a considerable analytical problem, one that many biological researchers regard as the toughest part of a study. The emerging science of bioinformatics becomes very helpful in that case. Bioinformatics is the discipline in which large amounts of data are sorted into intuitive databases, analyzed and presented in an understandable form.
Analytical software draws comparisons between samples and genes across different biological conditions. One method that has been adapted for microarray data is called "clustering." Clustering programs use predefined algorithms to group significantly changed genes according to their strength of expression or pattern of expression across different experiments.
A subset of the spots plated onto a chip carrys known genes, but most microarray chips will contain a significant portion of unknown genes. The functions of many of these unknown genes may be revealed with the help of computing and bioinformatics resources. Much of the information generated is filed in large-scale public databases.
Annette DeFerrari
These databases are constantly updated with information such as the sequences of discovered genes, their current known function and their latest nomenclature. The National Center for Biotechnology Information (NCBI), a branch of the National Institutes of Health, creates public databases, conducts research in computational biology, develops software tools for analyzing genome data and disseminates biomedical information. An example of such a database is UniGene, which is an experimental system for automatically partitioning sequences in the larger GenBank database into a non-redundant set of gene-oriented clusters. Each UniGene "cluster" contains sequences that represent a unique gene, as well as related information, such as the tissue types in which the gene is expressed.
In addition to sequences of well-characterized genes, hundreds of thousands of novel expressed sequence tag (EST) sequences—sequences from genes that remain undidentified that are known only through their message—can be found in UniGene. This collection is an invaluable resource for microarray researchers, since a lot of the spots printed on chips are ESTs. Consequently, this resource facilitates the identification of a gene for which large-scale analysis indicates an involvement of some of the ESTs. Microarray users' results depend on these databases to ensure that their data reflect the latest updates on genes. This ultimately makes a microarray data set even more meaningful. In the near future, databases of expression profiles will be publicly available. These databases include information about the sample quality and conditions under which it was produced, hybridization conditions and quality, scanning quality and outlier lists. This database will be made available to all scientists interested in learning from the data. The database user or "virtual experimenter" will have information about many different compounds and their signature effects within the context of the defined biological model.
Microarray technology will undoubtedly have a profound impact on many avenues of biological and biomedical research, including toxicology, the main focus of our laboratory. Toxicology seeks to understand how chemicals from natural, synthetic or endogenous sources might affect humans and the environment. Here, scientists correlate gene expression patterns with biological and pathological assays to determine whether particular chemicals are harmful.
Toxicologists play an important role in defining the conditions under which chemicals may be safely employed for good causes and when a particular chemical should be avoided. Toxicologists also use gene-expression data to understand how particular toxicants affect the inner workings of the cell.
In the early days of toxicological assessment, it took months or years to establish the relation between a compound and the pathway it altered. In those days, investigators were unable to predict the key cellular players involved in the reaction of an organism to some form of environmental insult. These investigators were put in the position of essentially guessing which of the hundreds of cellular pathways might be affected. Testing these guesses to produce concrete results required the time and energy of many research teams working in concert for years, building on the information provided by previous groups. That the whole process might someday be undertaken by a group during a much shorter period of time was, just a few years ago, unimaginable.
New advances in genomics technology, such as the cDNA microarray chip, offer major shortcuts to many of our research problems. Investigators may identify important components in cellular pathways and characterize genetic footprints diagnostic for exposure to certain compounds. This technology may allow us to predict the cellular effects of new compounds—a boon not only to toxicologists but to the pharmaceutical industry as well. Use of this technology increases the efficiency of testing compounds for toxicological or pharmaceutical action and betters our understanding of which compounds to advance to later stages of clinical trials in humans.
As our use and expertise with microarray technology grows, we will have databases with expression profiles for hundreds, even thousands of genes. One will then be able to compare a new compound's expression profile to existing profiles. One might even be able to link the gene expression profile with chemical structure and predict which part of a certain molecule is responsible for the gene expression response. This technology improves our understanding of the effects of how introducing a gene into an animal might influence other biological functions.
Microarrays are certainly a giant leap into the future of performing quality biological research that holds the promise to aid in discovery of better chemicals, diagnostics and pharmaceutical compounds and ultimately, to improve the quality of life of future generations.
Click "American Scientist" to access home page
American Scientist Comments and Discussion
To discuss our articles or comment on them, please share them and tag American Scientist on social media platforms. Here are links to our profiles on Twitter, Facebook, and LinkedIn.
If we re-share your post, we will moderate comments/discussion following our comments policy.