This Article From Issue
January-February 2009
Volume 97, Number 1
Page 4
DOI: 10.1511/2009.76.4
To the Editors:
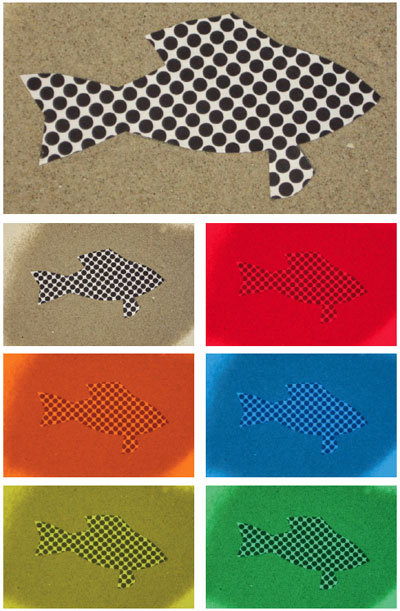
I enjoyed the article “UV Lights Up Marine Fish” (Jill Zamzow, et al., November–December 2008). The observations about pattern recognition versus camouflage (depending on a viewer’s distance) made so much sense that I decided to play with one aspect: light and dark. I created a pattern of large black dots with an overall reflectivity a bit less than 50 percent, about that of beach sand from Ocean City, N.J., where I lead public walks.

Image by Bryce M. Hand.
The first image shows what a fish shape looks like close up, against the sand background. (No question about easy recognition by companions!) From a (predator’s) distance, the fish is far less noticeable, especially if one looks slightly to the side or backs away. Since I hadn’t matched color (or devised a mixed pattern that would blend to sand color), I tried filters.
The article also raised questions. If the researchers lit their aquarium only in ultraviolet light (UV), would their fish behave differently? What about in white light lacking UV? Have they equipped fish with UV goggles?
The article reminded me of the “Yehudi” camouflage from World War II. It involved placing lights along the leading edge of wings (and elsewhere) on bombers to match the brightness of daylight. The planes’ visibility dropped dramatically, allowing fewer German U-boats time to submerge after spotting approaching aircraft. More were sunk.
Bryce M. Hand
Syracuse, NY
Dr. Zamzow responds:
If the aquarium were lit in UV only, we would expect that the fish might act differently. This would be akin to a human being in a setting lit only by blue or red light. When one scuba dives, more red light gets filtered by the water column the deeper you go, until you see a predominantly blue environment. If you scratch yourself on the reef, your blood looks dark green, not red (unless your buddy shines a dive light on it). Presumably a fish in a UV-only setting would perceive differently too. If we put fish that lack UV-transparent ocular media into a tank lit with UV only, they would see nothing at all. Certainly that would affect their behavior.
Studies have demonstrated that fish with UV vision (such as damselfish) can consume plankton in the water column with UV alone. How much behavior would be affected probably would vary across species. If one were to put fish under white light only, I would expect less effect since nearly the whole spectrum would be available. If the fish in question uses bright UV patterns to communicate, its behavior should change.
One of our collaborators, Uli Siebeck of the University of Queensland, has demonstrated that damselfishes will attack one of their own species viewed through UV-transparent plastic much more vigorously than one viewed through UV-opaque plastic.
We considered goggles but imagine trying to keep goggles on a slimy fish’s head. Yehudi camouflage is an appropriate analogy for breaking up one’s silhouette against a bright UV background!
American Scientist Comments and Discussion
To discuss our articles or comment on them, please share them and tag American Scientist on social media platforms. Here are links to our profiles on Twitter, Facebook, and LinkedIn.
If we re-share your post, we will moderate comments/discussion following our comments policy.