Dividing the Continent
By Brian Hayes
Without highway signs, how would we find the great divide?
Without highway signs, how would we find the great divide?

DOI: 10.1511/2000.41.481
It was the fourth day of a meandering coast-to-coast road trip. We were climbing through the Centennial Mountains along the Idaho-Montana border in an overloaded Toyota with a U-Haul luggage pod on the roof. As we crested Monida Pass, a sign at the roadside announced: Continental Divide, Elevation 6,823 Feet. "Well," quipped my traveling companion, "I guess it’s all downhill from here."
For miles afterward—as we climbed still higher hills and crossed the divide twice more—I pondered that remark. The great divide is the spine of the continent: Rain falling on one side trickles into the Pacific, and on the other side into the Atlantic. The concept is simple enough, but I kept wondering how we would have known we were crossing the divide if the highway department had not put up those helpful signs. The divide is not necessarily the high point of a cross-country journey, so what distinguishes it, geometrically or topologically? That morning in Idaho, it seemed even more enigmatic than other lines that people draw on the landscape. For example, a contour—a line connecting points of equal elevation—is something you could trace out by carrying around an altimeter, but there is no instrument that would help you find and follow the continental divide.
The long drive home offered us ample opportunity to noodle away at this puzzle. Being a computer-dependent person, my instinct was to address the question in algorithmic terms; I would know that I understood the answer when I could write a program to identify the divide. Out on the road, however, I could not put such a program to the test. I am also a library-dependent person, but the urge to go find out what others had to say was also frustrated. And thus for a week or so I had no choice but to actually think about the problem.
In a two-dimensional world, it’s easy to find a continental divide, if it exists. Think of an ant farm: a thin layer of soil sandwiched between two upright panes of glass. An ant walking along the surface of the soil from west to east will trace a one-dimensional profile, a graph of elevation as a function of longitude. If the profile has just one peak—that is, if the ant climbs steadily to some maximum elevation and thereafter descends continuously—then obviously that unique peak is the divide. ("It’s all downhill from here," the ant might well say.) If there are multiple peaks with valleys between them, the highest of the summits must be the divide.
Some pathological possibilities could spoil this easy analysis. The ant-farm profile could have several tallest peaks, all at exactly the same height, or a plateau might form a continuous line of highest points. In these cases there is no unique continental divide. But such landforms are unlikely. Ignoring them, the algorithm for finding the ant-farm divide is straightforward: Just look for the highest point.
Leaving behind the ant farm to consider a two-dimensional surface embedded in three-dimensional space, the divide problem gets more interesting. In particular, the find-the-maximum algorithm no longer works. Just try it for the case of North America! When you search out the highest point in the lower 48 states, you find yourself atop Mount Whitney, in California, elevation 4,418 meters. But Mount Whitney is nowhere near the continental divide, and all the water that falls on its flanks winds up in the Pacific, none in the Atlantic. (Indeed, much of it flows through the municipal water mains of Los Angeles.)
Brian Hayes
Thinking about this phenomenon on a larger scale raises doubts about the whole concept of a continental divide. Just as runoff can sneak around Mount Whitney, it can also find a path around the entire American Cordillera, which doesn’t really separate the Pacific from the Atlantic. After all, you can get from New York to San Francisco without climbing even the smallest hill: There is a sea-level route, around Cape Horn. From a topological point of view, a continental divide can exist only if a continent girdles the planet, so that the divide is a closed curve, with an inside and an outside.
Perhaps the best answer to this complaint is that the idea of a great divide belongs to the field of topography, not topology. Insisting on mathematical rigor is not necessarily helpful. In any case, we can rescue the concept of the divide, at the cost of making it somewhat artificial. The key step is to cut away a rectangular section of the earth’s crust, corresponding roughly to the lower 48 states, and put it in a high-walled glass box—a terrarium, not so different from the ant farm. Now a continental divide is either a closed curve that lies entirely inside the box, or else it is a continuous line whose endpoints are anchored to the glass walls. With this definition, the divide truly does divide the territory into separate regions.
How should the terrain inside the box be represented mathematically? One elegant idea is to make the earth’s surface the graph of a continuous function h(x,y), which defines a height h for every combination of x and y coordinates. (I assume the spherical surface is projected onto a plane. Also, it’s necessary to smooth out cliffs and overhangs, so that every x,y pair yields a unique h.) The main advantage of this scheme is that you can find maxima and minima of the height function by taking the derivative of h and looking for its zeroes. The disadvantage is that an equation for all of North America is likely to be quite unwieldy.
A more practical alternative is a discrete model, defining the elevation of the surface only at a finite number of points arranged in a grid. To keep things simple, let the grid be rectangular, formed by the intersections of evenly spaced north-south and east-west lines. Also, connect each grid point only to its four nearest neighbors, so that water on the model landscape flows only in the four cardinal directions. With this model of the terrain, the task of a continental-divide algorithm can be stated more concretely. For each grid point, the algorithm must answer the question: Does this point lie on the divide? Does it shed water into two basins that do not communicate with each other?
As we motored on into Montana, I tried to come up with a quick-and-easy algorithm to answer these questions. My first thought was to make the most of local information about the immediate neighborhood surrounding each point. I reasoned that the divide ought to run mainly along ridges, and ridges can be recognized by a distinctive pattern of higher and lower neighbors.
But analyzing neighborhoods proved messy. Each of a point’s four neighbors can be above, below or level with the central point, and so there are 34=81 possible configurations. That was too many cases to keep in mind while cruising down the Interstate, so I decided to simplify by pretending that no two adjacent grid points are ever at exactly the same height. (This ruse is not as unrealistic as it might seem; if you could measure elevations with infinite precision, the probability of finding two identical values would be zero.)
When all neighbors must be either higher or lower, there are 16 local configurations, and they can be further consolidated into just six classes. A peak is a point higher than all four of its neighbors, and a pit is lower than all of its neighbors. A point with exactly three lower neighbors lies on a ridgeline. The opposite case of three higher neighbors describes points along a valley bottom—a line known to topographers and crossword solvers as a thalweg. Finally, the points with equal numbers of higher and lower neighbors fall into two subclasses. If you stand on the central point and turn through 360 degrees to survey the neighbors, you might see them in a sequence such as above-above-below-below; a point of this kind lies on a slope. If the neighbors alternate, as in the sequence above-below-above-below, then the point is a saddle or pass. A saddle is special: It is the only kind of point that lies both on a ridgeline and on a thalweg.
Somewhere between Butte and Bozeman I began to doubt that this local classification was going to yield a useful algorithm. It doesn’t even help much in the two-dimensional case (where each point has only two neighbors instead of four). A divide in the ant farm always lies at a peak, but the local properties of peaks will not tell you which of them is the divide. Finding the highest peak requires global information; you have to compare points throughout the entire array.
For the three-dimensional model, the situation is even stickier. Not only is local information unable to identify the divide, but in addition there is no simple global property that will settle the issue. You can’t just compare each point with all the other points, looking for a maximum of some kind. Instead, you need to consider multiple pathways through the array of points.
But if local configurations can’t solve the divide problem, maybe they can at least rule out lots of points that might otherwise be candidates for the divide. For example, it seems beyond question that a pit cannot form part of the divide, and so all pits can be crossed off the list. But as we rolled on beyond Bozeman toward Billings, I gradually realized that no other kinds of points could be excluded. Peaks and ridges and saddles are clearly allowed on the divide. It might seem that slopes and thalwegs would be ineligible, but this is not so. Think of a river delta, where streams diverge and bifurcate. If such a delta were to form at the outlet of a high alpine valley right on the continental divide, with channels flowing down either side, then the entire area of the upstream valley would have to be considered part of the divide, including the slopes and the thalweg.
Admittedly, a river delta in the headwaters is a pretty unlikely landform, but algorithms are supposed to cope with even the oddest cases. And natural landscapes do offer oddities. Some maps show the great divide itself dividing in Wyoming, where it envelopes a high basin. Even stranger are some unnatural landscapes. At the Big Thompson Project in Colorado a tunnel carries water across the great divide—or rather under it, or under the ridge where it ought to run—and thereby alters the topological genus of the earth’s surface.
Over the next 200 miles, as we followed the eastbound Yellowstone River, I had several more bright ideas that proved faulty. For example, I thought I saw a way to extend the ant-farm algorithm to the 3D world. The first step would be to survey elevations along the south wall of the terrarium, and find the maximum. Then set out from this peak, moving to the highest neighboring point, then to the highest neighbor of that point, and so on. Stop when you come to another wall or when the path loops back on itself. I briefly believed that this procedure would trace out the divide. I had forgotten that the high point on the southern boundary is not necessarily on the divide, and so you might go wrong from the first step.
An attempt to patch up this idea led to another strategy, which I still find appealing even though it seems to be a dead end. Suppose you know the two points where a divide touches the perimeter of a square region, but the path through the interior of the square is entirely hidden. If you could cut the square into four smaller tiles, and determine where the divide crosses each of their sides (if at all), then you would begin to have a rough vision of its route. Quartering each of these squares yields 16 more, and then 64. Soon, it would be enough merely to know which sides of a square are crossed by the path, without trying to measure the exact position of the intercept. This is a classic divide-and-conquer algorithm, with a hint of deep recursive magic. Unfortunately, the magic is illusion. The algorithm’s initial supposition—that we know where the divide enters and exits each square—is unfounded.
Yet another idea also exploits the distinctive topology of the divide—the fact that it is either a closed curve or a curve with endpoints anchored to the boundary. Here’s the plan. Working from local neighborhood information, identify all the peaks and ridgelines, and paint them red. The labeled ridges will form a dense network, which probably traverses most or all of the divide, but it includes many other paths as well. To be able to see the divide clearly, you need to prune away the underbrush. Topology suggests a promising way to do it. The premise is that all the ridges except the divide must have at least one free end—a dangling terminal point like the end of a tree limb. You can find these free ends by scanning the array for red points that have only one red neighbor. Removing the end point creates a new vulnerable stump. If you repeat the scan until no more single-neighbor sites can be found, only the divide will remain labeled—or so I thought.
In some instances this procedure actually works, but it has serious weaknesses. In the first place, as noted above, the divide does not have to lie entirely on peaks and ridges, and so the first stage of the algorithm may fail to label some points it should. The second stage can also introduce errors. Suppose two closed loops of the divide are connected by a ridge that is not properly part of the divide system (water on both sides flows to the same basin). Because this extraneous section of ridge has no free end, it cannot be removed by the pruning procedure.
However tricky the divide problem may prove to be, a correct algorithm surely does exist, since nature somehow solves the problem. If all else fails, one can emulate the natural algorithm. The idea is to let raindrops fall on each grid point, and then follow the runoff as it drains toward lower elevations. The most thorough version of this algorithm pursues every downhill path. That is, if a point has three lower neighbors, then the algorithm follows droplets that roll along each of the three downhill links. The flow stops when the droplet reaches a pit and has nowhere more to go.
Tracing such paths for all points on the continent should identify the great divide. The divide is just the set of points from which droplets can reach both the Atlantic and the Pacific basins. (This is, after all, the definition of the divide.)
The rainfall algorithm works, at least for small test cases, but it is fabulously inefficient. An average point on the model landscape has two downhill neighbors, which means the number of paths to be explored doubles at every step. If a typical path is just 20 steps long, the algorithm will have to map a million paths for each point.
This exponential explosion of pathways should not be necessary. Real water droplets don’t explore all possible routes to the sea; for the most part, they stick to the path of steepest descent. An algorithm can do the same, which makes the computational burden much lighter. But there are other problems. The divide has to be defined somewhat differently—as a path threading between grid points rather than a connected series of points. And there is the lake-bottom problem: A path of steepest descent seldom descends continuously from the divide all the way to the ocean. It’s not all downhill from here.
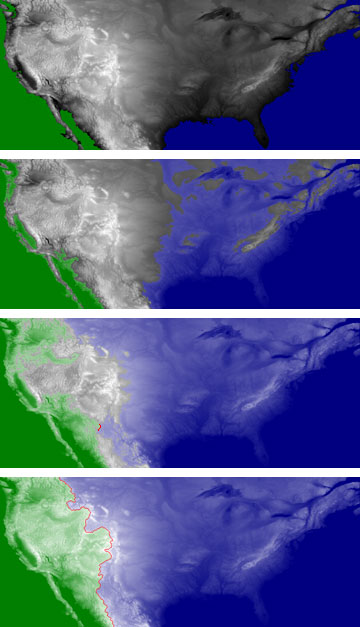
Somewhere in North Dakota or Minnesota—near another divide that separates Hudson Bay from the Gulf of Mexico—I finally began to settle on an idea that might be called the global-warming algorithm. It works like this: Given North America in a terrarium, start raising the sea level, and keep the floods coming until the Atlantic and the Pacific just touch. At this moment you have identified one point—namely the lowest point—on the great divide. Now continue adding water, but as the sea level rises further don’t allow the two oceans to mix. (This would be a difficult trick in a physical model, and it’s none too easy even in a computer simulation.) Note the succession of points on the land where east meets west, and mark them down as elements of the divide. When the last such point is submerged, you have succeeded in dividing the continent.
Describing this process in terms of water filling a basin tends to conceal some of the nitty-gritty computational details. Real water is very good at flooding; it just knows how to do it and never makes a mistake. Simulated water, on the other hand, must meticulously plot its every move. To raise the level one foot, you have to check every point adjacent to the current waterline and decide which points will be newly submerged. Then you have to look at the neighbors of these selected points, and at their neighbors, and so on. There’s the potential for another exponential explosion here, although with realistic landscapes it doesn’t seem to happen.
When I finally got a chance to write a program for this process, I found that the algorithm is exquisitely sensitive to the order of operations. Consider the situation just as the Pacific is about to reach the lowest point on the divide. If the Atlantic has not been raised in synchrony, then the Pacific waters will pour over the saddle point and flood part of the eastern basin, shifting the divide to an incorrect position.
Back home again, and plugged in to libraries as well as computers, I was not surprised to learn that others had gone before me in thinking about the nature of watersheds and divides. But I was surprised to learn just who my predecessors were.
Two of the best publications on the subject are short papers by Arthur Cayley (a founder of topology and graph theory) and James Clerk Maxwell (the author of the electromagnetic theory of light). Cayley and Maxwell do not focus on continental divides—perhaps the concept is not an obvious one for residents of an island nation—but their analysis of landforms in general clarifies aspects the divide problem. They emphasize peaks, pits and saddles as the keys to delineating the fundamental regions of a landscape.
Much as Euler gave a formula for the number of faces, edges and vertices in a polyhedron, Maxwell relates the number of topographic peaks, pits and saddles on a surface. In the case of a sphere, the formula is p+q–s=2, where p is the number of peaks, q the number of pits and s the number of saddles. Maxwell also outlines a procedure for dividing the landscape into watershed regions. Whereas all my own methods progressed either down from peaks or up from pits, Maxwell argues that the right way to do it is to start in the middle—at a saddle—and proceed toward both peaks and pits along lines of steepest ascent or descent.
The more recent literature on divides and watersheds held another surprise. I had expected to find work by geographers and cartographers, and indeed they have written extensively on the subject. But there is also a body of work by students of image analysis and artificial vision. The connection is clear once it’s pointed out. Just as a topographic map can be presented as an image in which elevation is encoded in brightness, so also a digitized image can be interpreted as a surface where altitude represents shades of gray or color. Finding watersheds in such a surface is a useful approach to identifying objects in the image.
The idea of using watersheds for image analysis was first proposed at the School of Mines in Paris in the 1970s. (The images that needed analyzing were micrographs of ore samples.) Workers there have continued to refine the method. The version of the algorithm I have found most helpful was devised by Luc Vincent and Pierre Soille when they were both working at the School of Mines.
The Vincent-Soille algorithm is related to what I have dubbed the global-warming method, but with a number of enhancements. One remarkably simple device greatly reduces the computational effort. In addition to storing the array of points that represents the landscape, they keep a list of the same points sorted in order of increasing elevation. With this list in hand, there is no need to search for points that will be submerged each time the water level rises; you can simply cross them off in order.
As it happens, one contemplated application of the watershed algorithm in image processing is the old dream of a car that drives itself. The "watersheds" detected in a video image might be the edges of a roadway. So perhaps the next time I cross the continental divide I’ll be able to pay more attention. I won’t have to keep my hands on the wheel.
© Brian Hayes
Click "American Scientist" to access home page
American Scientist Comments and Discussion
To discuss our articles or comment on them, please share them and tag American Scientist on social media platforms. Here are links to our profiles on Twitter, Facebook, and LinkedIn.
If we re-share your post, we will moderate comments/discussion following our comments policy.