Bit Lit
By Brian Hayes
With digitized text from five million books, one is never at a loss for words
With digitized text from five million books, one is never at a loss for words

DOI: 10.1511/2011.90.190
Books are being blown to bits. New ones are “born digital”; millions of old ones are being assimilated into the mind of the machine.
Some people question the wisdom of this transition to digital reading matter. Paper and ink have served us pretty well for a thousand years or more. Is it prudent to store everything we know in tiny smudges of electric charge we can’t see or touch? Critics also worry about who will wind up owning our cultural heritage. And then there are the sentimentalists, who say it’s just not the same curling up by the fireside with a good Kindle.
Well, I for one welcome our new computer overlords. And I would like to point out that books are not only for reading. There are other things we (and our computers) can do with the words in books. We can count them, sort them, make comparisons among them, search for patterns in their distribution, classify them, catalog them, analyze them. Yes, these are nerdy, mechanical, reductionist assaults on literature—but they are also methods of extracting meaning from text, just as reading is. And they scale better.
The data-driven approach to language studies got a big boost last winter, when a team from Harvard and Google released a collection of digitized words and phrases culled from more than five million books published over the past 600 years. The text came out of the Google Books project, an industrial-scale scanning operation. Since 2004 Google Books has been digitizing the collections of more than 40 large libraries, as well as books supplied directly by publishers. At last report the Google scanning teams had paged their way through more than 15 million volumes. They estimate that another 115 million books remain to be done.
At the Google Books website, pages of scanned volumes are displayed as images, composed of pixels rather than letters and words. But to make the books searchable—which is, after all, Google’s main line of business—it’s necessary to extract the textual content as well. This is done by the process known as optical character recognition, or OCR—a computer’s closest approximation to reading.
In 2007 Jean-Baptiste Michel and Erez Lieberman Aiden of Harvard recognized that the textual corpus derived from the Google Books OCR process might make a useful resource for scholarly research in history, linguistics and cultural studies. There are many other corpora for such purposes, including one based on a Google index of the World Wide Web. But the Google Books database would be special both because of its large size and because of its historical reach. The Web covers only 20 years, but the printed word takes us back to Gutenberg.
Michel and Aiden got in touch with Peter Norvig and Jon Orwant of Google and eventually arranged for access to the data. Because of copyright restrictions, it was not possible to release the full text of books or even substantial excerpts. Instead the text was chopped into “n-grams”—snippets of a few words each. A single word is a 1-gram, a two-word phrase is a 2-gram, and so on. The Harvard-Google database includes 1-, 2-, 3-, 4- and 5-grams. For each year in which an n-gram was observed, the database lists the number of books in which it was found, the number of pages within those books on which it appeared and the total number of recorded occurrences.
The n-gram database is drawn from a subset of the full Google Books corpus, consisting of 5,195,769 books, or roughly 4 percent of all the books ever printed. The selected books were those with the highest OCR quality and the most reliable metadata—the information about the book, including the date of publication.
A further winnowing step excluded any n-gram that did not appear at least 40 times in the selected books. This threshold, cutting off the extreme tail of the n-gram distribution, greatly reduced the bulk of the collection. Combining the 40-occurrence threshold with the 4 percent sampling of books, a rough rule of thumb says that an n-gram must appear in print about 1,000 times if it’s to have a good chance of showing up in the database.
The final data set covers seven languages (Chinese, English, French, German, Hebrew, Russian and Spanish) and counts more than 500 billion occurrences of individual words. The chronological range is from 1520 to 2008 (although Michel and Aiden focus mainly on the interval 1800–2000, where the data are most abundant and consistent).
This past January, Michel, Aiden and a dozen co-authors from Harvard, Google and elsewhere published a research article in Science introducing the new linguistic corpus and presenting some of their early findings. They also announced the Google Books Ngram Viewer, an online tool that allows anyone to query the database. Finally, they made the entire n-gram data set available for download under a Creative Commons license.
Some of the results reported in the Science article show how n-gram data can be used to document changes in the structure of language. One study examines the shifting balance between regular and irregular verbs in English—those that form the past tense with -ed and those that follow older or odder rules. Between 1800 and 2000 six verbs migrated from irregular to regular (burn, chide, smell, spell, spill and thrive) but two others went the opposite way (light and wake). In the case of sneaked vs. snuck, it’s too soon to tell.
Michel and Aiden describe their work as culturomics, a word formed on the model of genomics (but not yet to be found in the n-gram data set). In the same way that large-scale collections of DNA sequences can reveal patterns in biology, high-volume linguistic data can aid the analysis of human culture. For example, Michel and Aiden examined changes in the trajectory of fame over the past two centuries by counting occurrences of celebrity names. According to the n-gram analysis, modern celebrities come to public attention at an earlier age, and their fame grows faster, but they fade faster, too. “In the future, everyone will be famous for 7.5 minutes,” they remark (attributing the quote to “Whatshisname”).
Another study looked at linguistic evidence of censorship and political repression. In English, the frequency of the name Marc Chagall grows steadily throughout the 20th century, but in German texts it disappears almost entirely during the Nazi years, when the artist’s work was deemed “degenerate.” Similar cases of suppression were found in China, Russia and the United States. (The American victims were the Hollywood 10—writers and directors blacklisted from 1947 until 1960 because of supposed Communist sympathies.)
Having found that known cases of censorship or suppression could be detected in the n-gram data, Michel and Aiden then asked whether new instances could be identified by searching among the millions of time series for those with a telltale pattern. In the case of the Nazi era, the team devised a “suppression index” that compares n-gram frequencies before, during and after the Hitler years. Starting with a list of 56,500 names of people, they found that almost 10 percent showed evidence of suppression in the German-language data, but not in English.
Reading about these experiments gave me the itch to try running some of my own. And it turns out that many interesting questions can be investigated with little effort and no cost using the Google Ngram Viewer (http://ngrams.googlelabs.com). The protocol for this service is simple: Type in a comma-separated series of n-grams, and get back a graph showing their frequency as a function of time. The frequencies are normalized to adjust for linguistic inflation—the expansion of the language as more books are published each year. The normalized frequency is the number of occurrences of an n-gram in a given year divided by the sum of all n-gram occurrences recorded in that year.
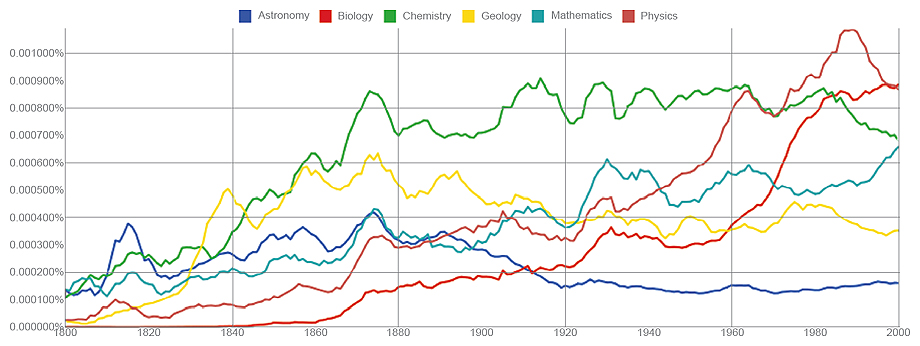
Shown above is the Ngram Viewer’s output in response to a simple query—a list of six nouns. Interpreted with care, a chart like this one might tell us something about the shifting fortunes of scientific disciplines—but the careful interpretation is crucial. This is a popularity contest among words, not among the concepts they denote. From the graph it would appear that Biology did not exist before about 1840—and that’s close to the truth if we’re speaking of the word itself. But the science of living things goes back further.
The curves have some curious features that I can’t explain, such as synchronized humps in about 1815 and 1875. Was there a real (but short-lived) upsurge in publishing books on the sciences in those years? Or are we seeing some artifact of librarianship or the selection process? The geology curve appears to have a persistent oscillation with a period of roughly 20 years. What, if anything, is that about?
The same query words without the initial capital letters yield somewhat different results. So do the corresponding agent nouns—astronomer, biologist, and so forth.
The Ngram Viewer can become an absorbing (and time-consuming) entertainment. You might even turn it into a party game: One player draws the graph, the others try to guess the query. But less-frivolous applications are also within reach. Here’s one possibility: With well-crafted queries, it might be possible to gauge the penetration of various foreign languages into English publications (or vice versa). From a very small sample, I get the impression that the frequency of German words in English text sagged during the World Wars, whereas Russian peaked in the Cold War.
The Viewer is an excellent oracle for the n-gram data, but it answers just one kind of question: How has the frequency of a specific n-gram varied over time? Many other questions cannot be expressed in this form. You might want to know which n-grams are the most common, or how word frequency varies as a function of word length, or which words entered the printed record first. To answer these questions and others like them, you’ll have to work a little harder. For starters, you’ll have to download the data, which is not a trivial undertaking.
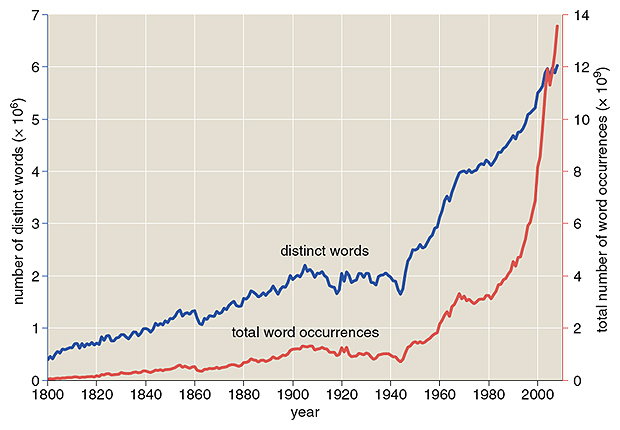
Illustration by Brian Hayes.
The complete set of English n-grams weighs in at 340 gigabytes of compressed files, which expand to fill 2.5 terabytes of disk space. I have not yet tried to swallow all that data; doing anything interesting with it would require more hardware. I have been working solely with the English 1-gram files, which amount to 10 gigabytes when decompressed. I’ve been able to manage them on a laptop, although I’ve needed a refresher course in “external” algorithms—those that manipulate data on disk rather than in main memory. (This was a common practice when memory topped out at 64 kilobytes, but that was a long time ago.)
The 1-gram data are scattered over 10 files, which I merged into one. Then I set about gathering some basic facts and figures. In the English 1-gram data set there are 7,380,256 unique words, which occur a total of 359,675,008,445 times. Thus the mean number of occurrences per word is 48,735—but that’s a somewhat misleading number, because the distribution is highly skewed. (The top 100 words account for half of all word occurrences.) A more meaningful statistic is the median, which is 166.
Which are the most common 1-grams? Setting aside a few common marks of punctuation, the highest-frequency words are: the, of, and, to, in, a, is, that, for, was. Another trivia question: What’s the longest word in the corpus? I think the longest that’s really a word and that wasn’t invented just to set records is phosphoribosylaminoimidazolecarboxamide.
Prowling around in the data with a text editor reveals a multitude of oddities. Choose an entry at random, and it’s likely to be a word you’ve never seen before. Indeed, there’s a good chance it’s not a word at all in the strict sense, but rather a number or a mixture of letters and digits, or something even more mysterious. For example, my eye fell on this curious “word”:
BOBCATEWLLYUWXCARACALQW
How could such a zany-looking string of letters turn up at least 40 times in published books? As it happens, we have a tool for answering such questions, namely Google Books. Since the Google OCR program produced this string, the Books search engine should be able to find it. And there it is: a row of letters in a word-search game—a game that has apparently been reprinted in dozens of puzzle books.
On looking at the numbers included in the n-gram archive, I was surprised at first by their abundance. Of the 7.4 million unique 1-grams, about 7 percent are numbers or numberlike strings of digits. But the explanation is straightforward: Numbers have higher entropy than words. Only a tiny fraction of all possible sequences of letters make a meaningful word, but almost any combination of digits is a properly formed number. Thus for a given total quantity of numbers, we can expect to find greater variety.
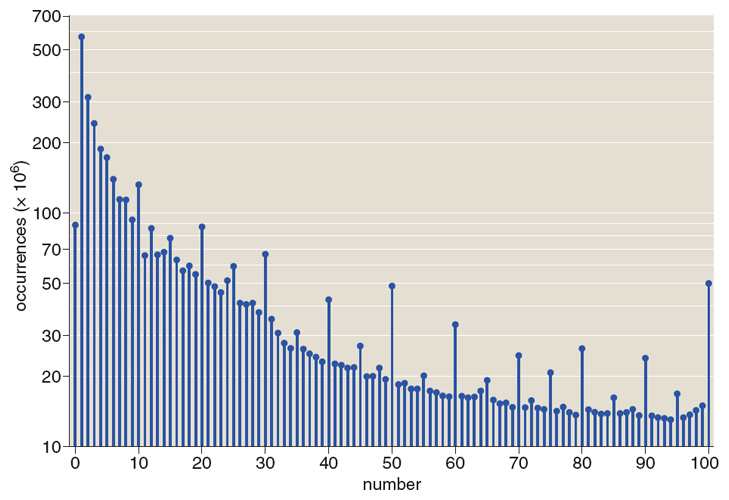
Illustration by Brian Hayes.
To look more closely at the numeric 1-grams, I had to decide exactly what I would accept as a number. The OCR system allows mixed strings of letters and digits (1Deut, Na2SO4), but I wanted to consider just “pure” numbers, those that denote a definite numeric value or magnitude. I decided to accept any sequence of characters consisting entirely of digits or digits with a single embedded decimal point. The OCR program also accepts numbers preceded by a “$” sign, so I collected those dollar amounts too, but in a separate file.
Many different numerals can represent the same number: 01, 1, 1.0, 1.00 and 1.000 are all listed separately in the 1-gram files, but they all designate the same mathematical magnitude. I consolidated these items under the canonical value 1.0, and merged their yearly occurrence data into a single record. This procedure is not without drawbacks, in that it treats as numbers some items that aren’t meant to designate a numeric value, such as Zip codes. But I don’t know how to weed out those items.
The number list I compiled has 458,794 unique values. The smallest is necessarily 0, since the OCR process strips away any minus signs. What’s the largest entry? It’s the number formed by repeating the digit 7 exactly 80 times. When I looked up the origin of this curious value, I discovered images of computer punch cards, with labeled rows of 80 columns.
The first thing I did with the numbers was check to see if they obey Benford’s law, which describes the distribution of first digits in most of the numbers we meet in everyday life, such as those in stock-market tables. The law predicts that 1 is the most common leading digit, with higher digit values getting progressively rarer. In the theoretical distribution the frequency of digit d is proportional to log10(1+1/d).
When I tested the 1-gram numbers against the predictions of Benford’s law, the result was inconclusive. As expected, smaller first-digit values are more common among the 1-grams, but the preference for 1 is even more exaggerated than the Benford distribution predicts. The first digit should be a 1 about 30 percent of the time, but the actual frequency is 43 percent. Maybe those Zip codes are causing trouble?
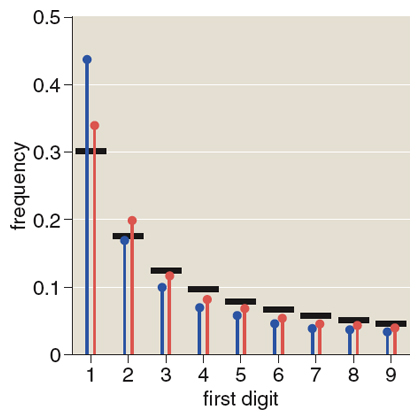
Illustration by Brian Hayes.
I have another hypothesis: The distortion is caused by the times we live in! High on the list of popular numbers are values that look like years, almost all of which begin with 1. Numbers such as 2000, 1990, 1992 and 1980 are roughly 100 times more frequent than other four-digit numbers. To test my hypothesis I created an altered data set in which all numbers in the range 1800–1999 have their frequency artificially reduced by a factor of 1/100. The result is considerably closer to the Benford distribution, with 1 having a frequency of 34 percent (see illustration above).
Something else revealed by this collection of numeric data is the extraordinary human fondness for round numbers. The illustration at the top of this page plots the abundance of the first 100 integers. For the most part, frequency decreases with increasing magnitude, but numbers that are “rounder”—divisible by 10, or if not by 10 then by 5—stand out above the crowd. (Also note that the integers 7 and 11, which by some vague measure might be taken as the least round numbers, are curiously depressed.)
Dollar amounts are even more dramatically biased in favor of well-rounded numbers. I had expected the monetary subset to be full of numbers ending in 99. Maybe that will be the case if we ever get an archive of junk mail and supermarket advertising, but in books there’s a distinct preference for trailing zeros. The most popular dollar amounts are 1, 100, 2, 5, 10, 1000, 10000.
Michel and Aiden set out to study language and culture, but they have also created a resource for the study of optical character recognition.
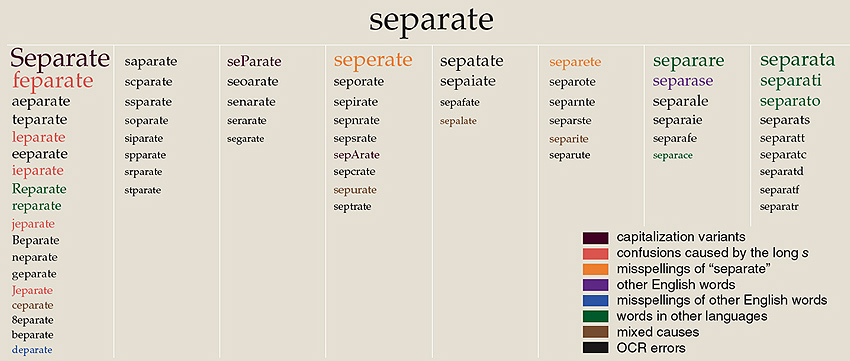
Illustration by Brian Hayes.
Based on a random sample from the 1-gram files, I estimate that 15 percent of the entries are affected in some way by OCR errors or anomalies. This sounds horrendous, but it does not mean that the OCR program made mistakes on 15 percent of the words it read; the word-recognition error rate is probably well under 1 percent. The problem is that there’s only one way to read a word correctly, but there are countless ways to go wrong. Suppose the program reads 1,000 words and gets 990 of them right. If it makes a different mistake on each of the remaining 10 words, then the final list has 11 entries, 10 of which are erroneous.
Because of this effect, efforts to tidy up OCR errors would not only improve the accuracy of the data set but would also reduce its bulk. Entries for Rccovery, Reeovery, Reoovery, Rerovery and Revovery could all be merged into Recovery. But making such repairs is a daunting task, especially if you want to preserve other variations and errors, introduced not by the OCR process but by authors and printers.
Consider: bomemaker is probably an OCR error; invertibrate is probably a human error; cerimoniale is probably not English. What about haccalaureate? Is that an OCR error or is it a degree granted by a programming school? A human reader can make judgments in such cases, but hand-grooming multigigabyte files is not an attractive prospect. We need a mechanized solution.
A few special cases look doable. The OCR program has encoded some instances of “fi” and “fl” as ligatures, combining the two letters into a single character, while other instances remain as pairs of letters. For most uses of the data set, it would probably be better to treat all these cases consistently; this seems easy to accomplish.
More challenging but perhaps still within reach is the problem of the “long s” that was part of English orthography through the 18th century as in:

OCR programs (like many human readers) tend to interpret this character as the letter “f,” leading to an abundance of comical fricative spellings such as quickfilver and abfceffes. I suspect that an algorithm could successfully correct a large fraction of these misreadings without turning too many flaws into slaws.
The idea is to make a change only when the “s” form of a word is substantially more common than the “f” form and when the “f” version has a strong peak of popularity before 1800. But I have not yet tried implementing this algorithm, so I don’t know how many new errors it will introduce.
With other OCR quirks, the chronological clue is lacking, and so we must resort to blunter tools such as a matrix estimating the probability that any one character will be mistaken for another. No doubt much can be accomplished in this way. On the other hand, if these mistakes were easy to fix, they would have been fixed already.
Suppose we had a magically cleansed version of the Harvard-Google database, free of all OCR errors. Would the time-series graphs from the Ngram Viewer look much different? I doubt it. Thus for present purposes the noise introduced by the OCR process is a minor distraction we can safely ignore.
But there are purposes beyond the present ones. Google has announced the grandiose goal of digitizing all the world’s books. They may succeed. Some of those books may survive only in digital versions. And someone may even want to read them! If the scanning protocol now in use is the main channel by which we are to transmit 600 years of human culture to future generations, there’s reason to worry.
But for the moment I am not inclined to complain. The n-gram collection released by the Harvard-Google team is a marvelous gift. I would much rather have it now than wait for some unattainable level of perfection. And now that it’s been made public, it’s ours as well as theirs, and we can all help improve it.
©Brian Hayes
Click "American Scientist" to access home page
American Scientist Comments and Discussion
To discuss our articles or comment on them, please share them and tag American Scientist on social media platforms. Here are links to our profiles on Twitter, Facebook, and LinkedIn.
If we re-share your post, we will moderate comments/discussion following our comments policy.