A More Universal Language
By Robert Frederick
Seeking to better describe the world, researchers are attempting to blend the languages of science and art.
Seeking to better describe the world, researchers are attempting to blend the languages of science and art.

There are many visualization tools for displaying output from data-intensive calculations, but this tool may be the first one that incorporates rice noodles: The collaborative effort between artists and researchers to build the tool also uses shaved wax, ink, clay, and found objects that are scanned into digital form and then used within supercomputer simulations. “What we’ve created,” says Daniel Keefe about his team’s visualization tools, “is a way for artists to create scientific visualizations using all the tools they would use in their art studios.”
Keefe researches data visualization and interactive graphics at the University of Minnesota. He’s also a painter and met his co-project investigator, practicing artist and researcher Francesca Samsel, in 2011 when he judged an art contest at a computer visualization conference (Institute of Electrical and Electronics Engineers’s Visweek).
“One of the issues that happens in computer visualization is cacophony,” says Samsel, who is also a research scientist in the Texas Advanced Computing Center at the University of Texas at Austin. “That’s because the scientists want to see more“ of the data they need to visualize all at once, she adds. “So you throw more in there and then it’s a mess.” So with funding from the National Science Foundation, Keefe and Samsel teamed up with their colleagues to create new visualization tools inspired by objects and nature, in order to capture subtleties that can convey additional data without becoming visually overwhelming.
Daniel Keefe, Francesca Samsel, et al.
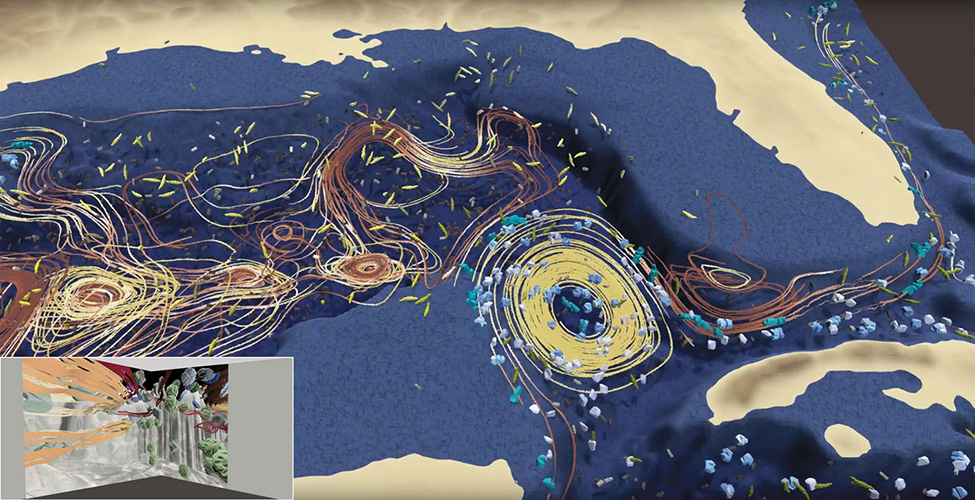
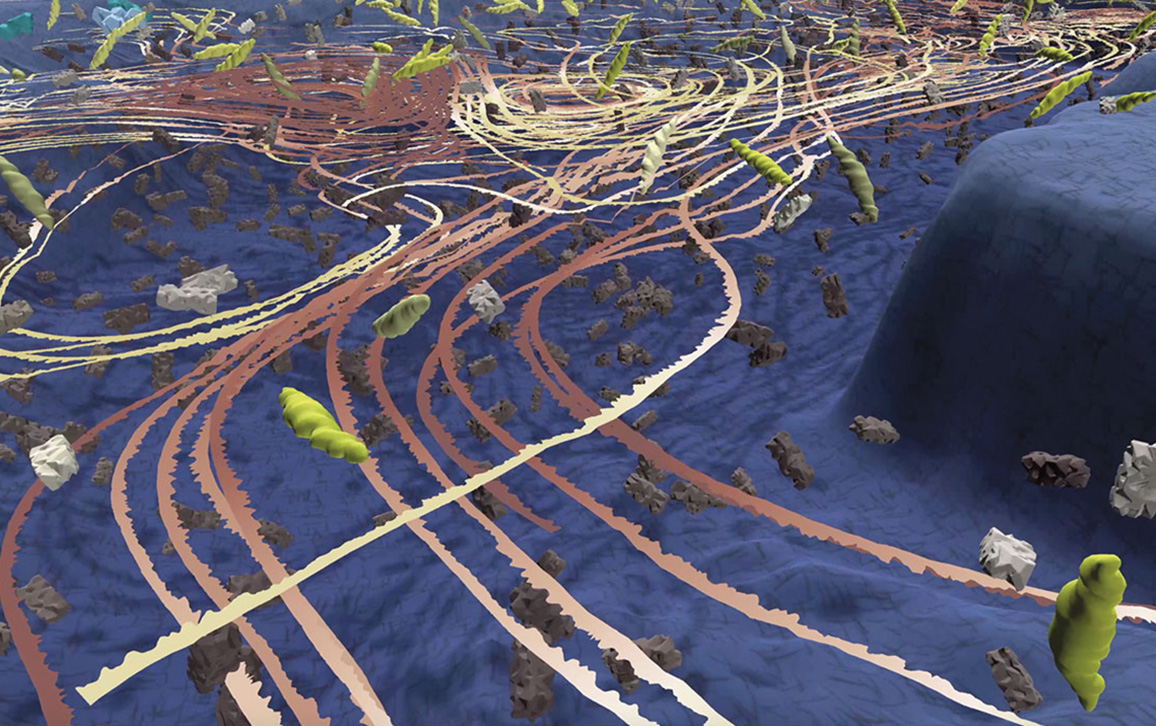
For example, regarding the visualization of fluid flow, Keefe says, “Typically that’s displayed using three-dimensional arrows or cones that you orient in the direction of the flow. But that’s not the rich visual language that an artist uses.” In Salt, Chemistry and Cultivation (pictured above), which was created by the team, lines of blending colors show the directionality and tightness of eddies of dissolved carbon. That makes it easier to identify optimal locations for the cultivation of sargassum, a macroalgae that creates habitats for fish. Sargassum could also help restore the Gulf of Mexico’s biogeochemistry and serve as a source of biofuel. “These are complex scenes, and you can make sense of them in two dimensions,” says Samsel, “but when you put on virtual reality (VR) goggles it is mind-boggling: I would never, ever, ever have thought that you would get that level of clarity.”
Along with VR goggles, a high-end computer is needed to navigate the data directly. So the team planned to project the visualization onto the corner of a room (inset) in order that people could experience a movie of the visualization in a way that completely fills a viewer’s visual field. The unveiling of their visualization, which was supposed to take place at this year’s South by Southwest Festival, was postponed because of the coronavirus pandemic. But the visualization tools can do more than just convey science to the festival-going public. “The idea is to enable nonscientists to work with actual data to communicate issues that are critical to humanity,” says Samsel.
The Texas Advanced Computing Center
“If you can broaden participation in the scientific process to include society’s best visual thinkers,” adds Keefe, “what you get is an ability to more accurately and more deeply convey your data.”
Daniel Keefe, Francesca Samsel, et al.
Some of the team’s visualization tools have already been released to the visualization community and are available to anyone. Keefe says that the full software package is coming soon and includes simple interfaces that allow for the kind of iterative experimentation that is more common to artistic expression than to computer programming.
A podcast with the researchers:
Click "American Scientist" to access home page
American Scientist Comments and Discussion
To discuss our articles or comment on them, please share them and tag American Scientist on social media platforms. Here are links to our profiles on Twitter, Facebook, and LinkedIn.
If we re-share your post, we will moderate comments/discussion following our comments policy.